


| World Journal of Nephrology and Urology, ISSN 1927-1239 print, 1927-1247 online, Open Access |
| Article copyright, the authors; Journal compilation copyright, World J Nephrol Urol and Elmer Press Inc |
| Journal website http://www.wjnu.org |
Original Article
Volume 1, Number 1, February 2012, pages 29-35
Effects of BMI on Blood Pressure and Urinary Excretion of Sodium, Chloride and Potassium in Young Paraguayans
Tania Campagnolia, Lorena Gonzalez Starka, Maria de los Angeles Ojedaa, Francisco Santacruza, Carlos Franco Palaciosb, c
aUniversidad Nacional de Asuncion, School of Medicine, Asuncion, Paraguay
bDivision of Nephrology and Hypertension, Mayo Clinic, Rochester, MN. USA
cCorresponding author: Carlos Franco Palacios, 200 First Street SW, Rochester, MN 55905, USA
Manuscript accepted for publication December 30, 2011
Short title: Effects of BMI
doi: https://doi.org/10.4021/wjnu8e
| Abstract | ▴Top |
Background: Obesity has been associated with an increased risk for coronary disease, type 2 diabetes, hyperlipidemia and mortality. The demographics of Paraguay show that most of the population is of mixed European and Amerindian descent. Most of the studies performed in Hispanics, particularly in the United States fail to identify their country of origin. There is a paucity of data in Paraguay about the relationship between BMI and BP in young adults. Furthermore, there is an increased prevalence of overweight, obesity and hypertension in the country. In this study, we hypothesized that even early increments of BMI are associated with increased blood pressure (BP) readings in young adults in Paraguay.
Methods: Cross-sectional study, performed in 72 adult participants, from Asuncion Paraguay. There is no similar study published in this country. BMI, BP readings and urinary excretion of Na, K and Cl were studied.
Results: Mean age 25.2 ± 1.52 years. Mean BMI 24.1 ± 3.66. There was a linear relationship between BMI and SBP, DBP, MAP and urine Na, K and Cl across all levels. A multivariate analysis, adjusting for gender, showed that increased BMI is associated with increased BP readings. A BMI of 23.4 was the best cut-off for a BP equal or higher than 135/85 mmHg (pre- hypertension), (AUC = 0.80). A BMI of 24.2 was the best cut off for a BP equal or higher than 140/90 (AUC = 0.80). After excluding participants with SBP equal or higher than 140 mmHg and DBP equal or higher than 90 mmHg, BMI was still associated with increased SBP and DBP even in normotensive individuals. After excluding obese and overweight patients, we found that even a small increase of BMI was associated with an increase in blood pressure.
Conclusions: BMI values of 24.2 and 23.4 were associated with BP of 140/90 and 135/85 respectively. Since the BMI cut-off for obesity was established in different cohorts, we might need to create a more specific set of values for the Paraguayan population, as the values proposed by the American Heart Association are probably rather high for this population.
Keywords: BMI; Hypertension; Paraguayan adults
| Introduction | ▴Top |
Obesity has been associated with an increased risk for coronary disease (CAD), type 2 diabetes, hyperlipidemia and mortality. A recent meta-analysis observed an increase of about 30 % in the risk of coronary artery disease with each five-unit increase in Body Mass Index (BMI). Even moderate overweight translates into an increased risk of CAD after adjusting for other traditional risk factors [1, 2].
Epidemiological studies show a linear rise in systolic blood pressure (SBP) between the ages of 30 to 80 and a concurrent early increase in diastolic blood pressure (DBP) until the age of 50 - 60. After that, the diastolic pressure level stabilizes or even declines. The relationship between obesity and age is also well described. In most studies, an almost linear relationship was found between BMI, SBP and DBP. This association was mostly seen in overweight and obese patients, with more than 75% of patients with hypertension (HTN) having a BMI ≥ 25 kg/m2
Approximately 20 percent of Americans between the age of 25 and 34 are obese; another 10 percent of the population becomes obese with each succeeding decade up to the age of 55. The prevalence of obesity is even higher in minorities and inner city populations. The risk of becoming overweight is highest in those aged 35 to 44 years, further favoring an early preventive approach. It has been recommended that obesity prevention should begin among adults in their early 20s [3, 4].
Different treatment cutoff points are based upon the presence or absence of obesity-related comorbid disease. In general it is believed that BMI values less than 25 warrant no intervention [5].
The demographics of Paraguay show that most of the population is of mixed European and Amerindian descent. The ethnic distribution is different from other countries in Latin America, as the proportion of indigenous population is very small. Most of the studies performed in Hispanics, particularly in the United States fail to identify their country of origin. Consequently, it is difficult to apply the same obesity guidelines in this population [6].
There is a paucity of data in Paraguay about the relationship between BMI and BP in young adults. Furthermore, there is an increased prevalence of overweight, obesity and hypertension in the country.
In this study, we hypothesized that even early increments of BMI are associated with increased blood pressure (BP) readings in young adults in Paraguay.
| Methods | ▴Top |
This was a cross-sectional study, performed in 72 young adult participants, from Asuncion Paraguay. There is no similar study published in this country. The study was approved by the institutional Ethics Department.
Information about history of hypertension, tobacco use, dietary intake, alcohol use, and level of exercise, anticonceptive use, drugs and other stimulants was recorded. Blood pressure was measured in the seated position by the same physician. Hypertension was defined as SBP equal or higher than 140 mmHg, and or DBP equal or higher than 90 mmHg in two different occasions and/or need of antihypertensive medications. Body weight was measured by a balance scale. Height was measured without shoes. BMI was calculated as weight/height2 (kg/m2).
Waist circumference was measured at the level midway between the lower rib margin and the iliac crest using a steel tape measure. The circumferences were measured in a standing position.
Measuring blood pressure: Standardize measurement of blood pressure was performed. The standard instrument that was used throughout the study is the sphygmomanometer. Uniform methods of measurement were applied. These methods included preparation of the participant (avoidance of recent meal intake, smoking or strenuous activity in the 30 minutes before measurement, bladder emptied, seated at rest for 5 minutes, legs not crossed); recording measurement circumstances (day of the week, time, indoor or outdoor temperatures), and technical procedures (cuff selection and application, obtaining peak inflation level, lowering of mercury at 2mm/s). We took the blood pressure twice in different days and within each day we took it three times separated by 5 minutes and obtained an average.
Timing of urine collection: The period begun after the participant had emptied his/her bladder completely. All participants had to recollect all their urine until the same time they emptied it for the first time. We checked if the urine sample was complete by calculating the 24 hour urinary creatinine excretion and adjusting for body weight.
Statistical methods
JMP version 9 was used for the statistical analyses. A P value equal or less than 0.05 was considered statistically significant.
T-test, Mann Whitney U-test, chi square and Fisher exact test were used when indicated. Regression analyses were performed. In these models, we studied the association between BMI and SBP, DBP and MAP, urinary Cl, Na and K. We also performed correlation analyses.
BMI was treated as a continuous variable and categorical variable, the latter one by establishing a cut-off of > or equal to 25 kg/m2 as criteria for overweight.
BP was also treated as a continuous and categorical variable, with different cut-off values.
| Results | ▴Top |
In Table 1, the the baseline characteristics of the population ARE outlined. It is noted this is a young population.
 Click to view | Table 1. Baseline Characteristics |
Patients with BMI higher or equal to 25 had higher 24 hour urine excretion of Na, comparing to patients with lower BMI (Table 2). SBP, DBP and MAP were higher in participants with BMI values greater than 25 (Table 2).
Click to view | Table 2. Characteristics of Patients With BMI Lower and Higher Than 25 kg/m2 |
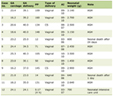
In general, increased BMI was correlated with increased urinary excretion of Na, K and Cl. On a linear regression analysis this difference persisted across the entire range of BMI. This could be probably due to a higher intake of salt (Fig.1).
 Click for large image | Figure 1. Urinary excretion of K, Na and Cl by BMI. K: P = 0.01, R2 = 0.31; Natriuria (Na): P = 0.0042, R2 = 0.33; Cl: P ≤ 0.0001, R2 = 0.49. |
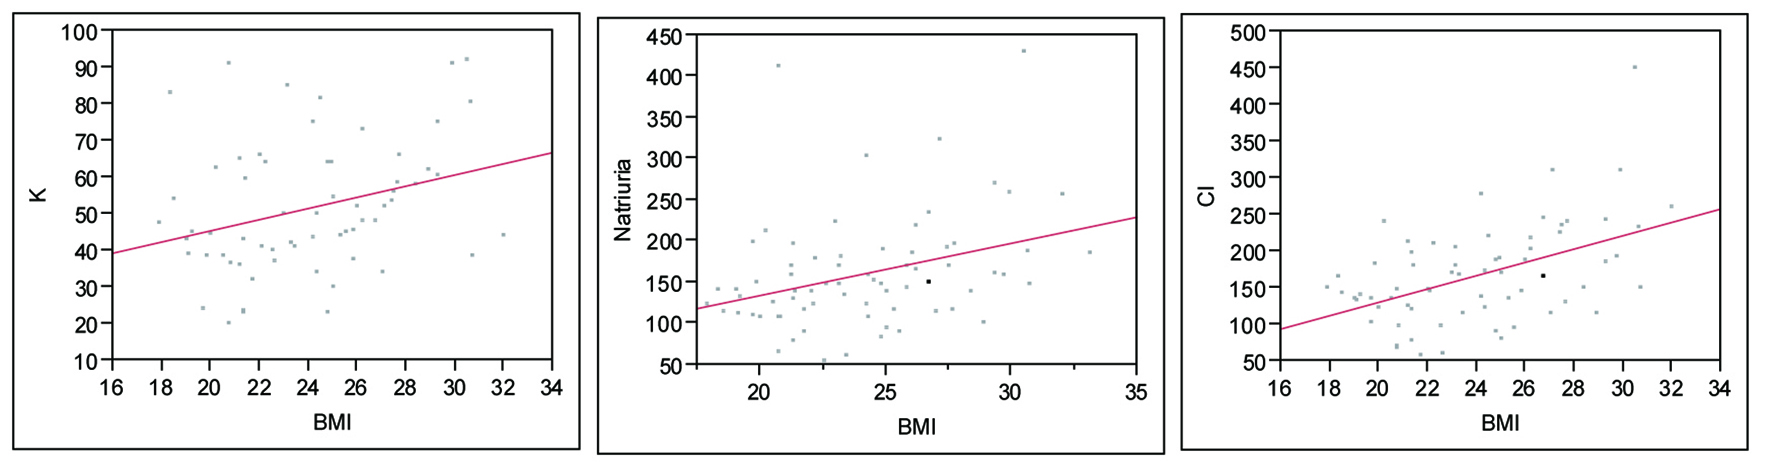
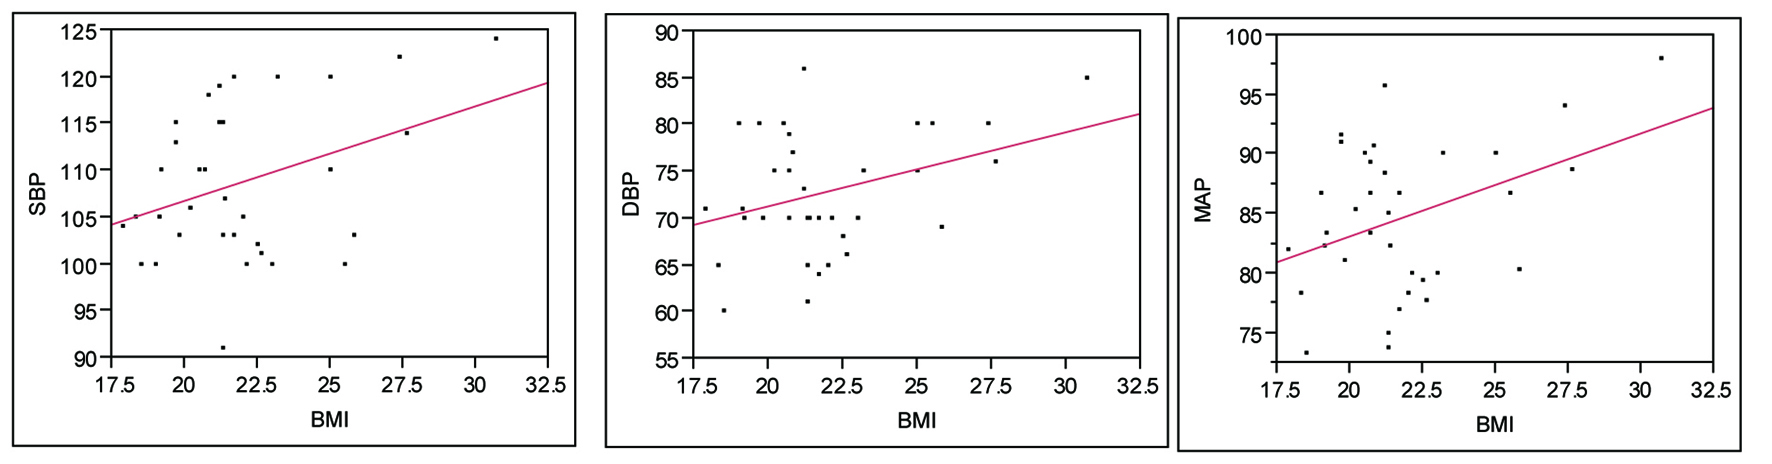
There was a linear relationship between BMI and SBP, DBP and MAP, across all levels. (Fig. 2) The same findings applied to abdominal circumference (not shown). There was a strongly positive correlation between abdominal circumference and BMI in this model, R = 0.88.
 Click for large image | Figure 2. BMI and Blood Pressure, entire cohort. SBP: P < 0.0001, R2 = 0.58; DBP: P < 0.0001, R2 = 0.51; MAP: P < 0.0001, R2 = 0.57. |
Mean BMI was higher in males (mean ± SD 26.4 ± 3.1) vs females (21.9 ± 2.6) (P < 0.0001). It is interesting to note that although males had higher BMI and BP readings, when dividing the groups in males vs females, BMI was more strongly associated to SBP, DBP and MAP in females (Fig 3, 4).
 Click for large image | Figure 3. BMI and BP in Males. SBP: P = 0.45, R2 = 0.13; DBP: P = 0.44, R2 = 0.14; MAP: P = 0.38, R2 = 0.16. |
 Click for large image | Figure 4. BMI and BP in Females. SBP: P = 0.02, R2 = 0.36; DBP: P = 0.03, R2 = 0.34; MAP: P = 0.01, R2 = 0.40. |
In a linear regression model, a statistically significant association of age and SBP was not observed. This is a fairly young population (Mean age = 25 years). Nonetheless, DBP did positively associate with increasing age (R2 = 0.05, P = 0.047).
A multivariate analysis, adjusting for gender, showed that increased BMI is associated with increased BP readings (Table 3).
Click to view | Table 3. Multivariate Analysis, Factors Associated With Elevated Blood Pressure |
A BMI of 23.4 was the best cut-off for a BP equal or higher than 135/85 mmHg (pre- hypertension), (AUC = 0.80, sensitivity = 85%, specificity = 65%).
A BMI of 24.2 was the best cut off for a BP equal or higher than 140/90, (AUC = 0.80, sensitivity = 92%, specificity = 61%).
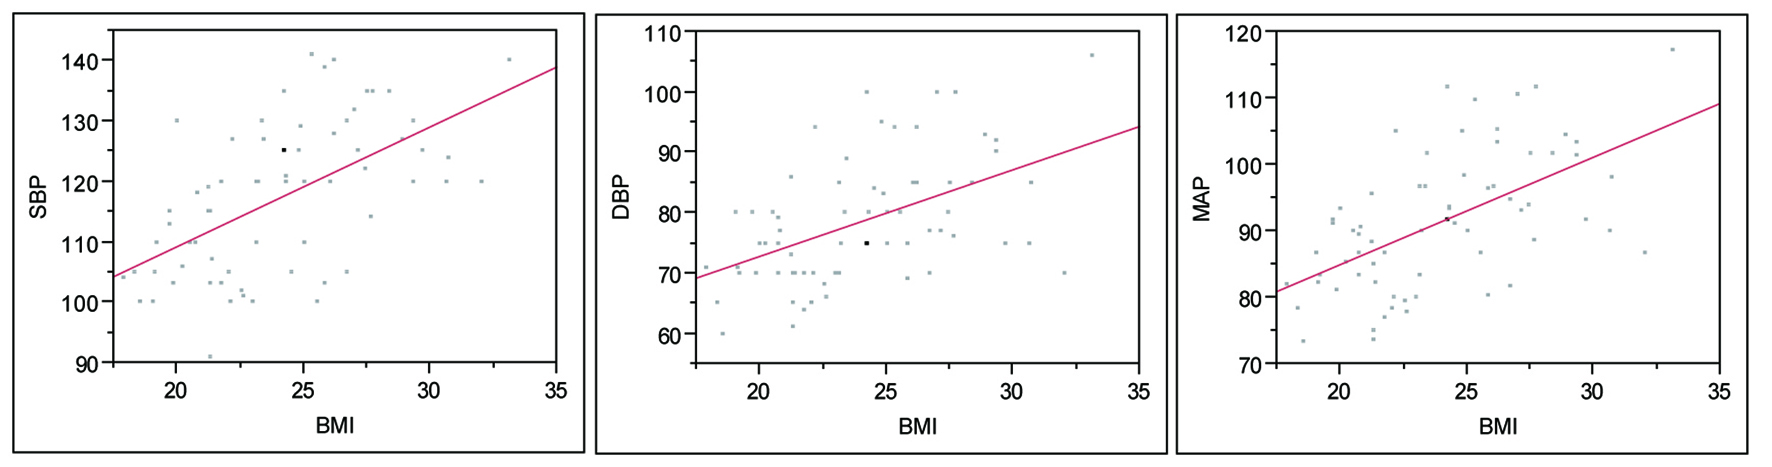
After excluding participants with SBP equal or higher than 140 mmHg and DBP equal or higher than 90 mmHg, BMI still correlated with increased SBP and DBP even in normotensive individuals (Fig. 5).
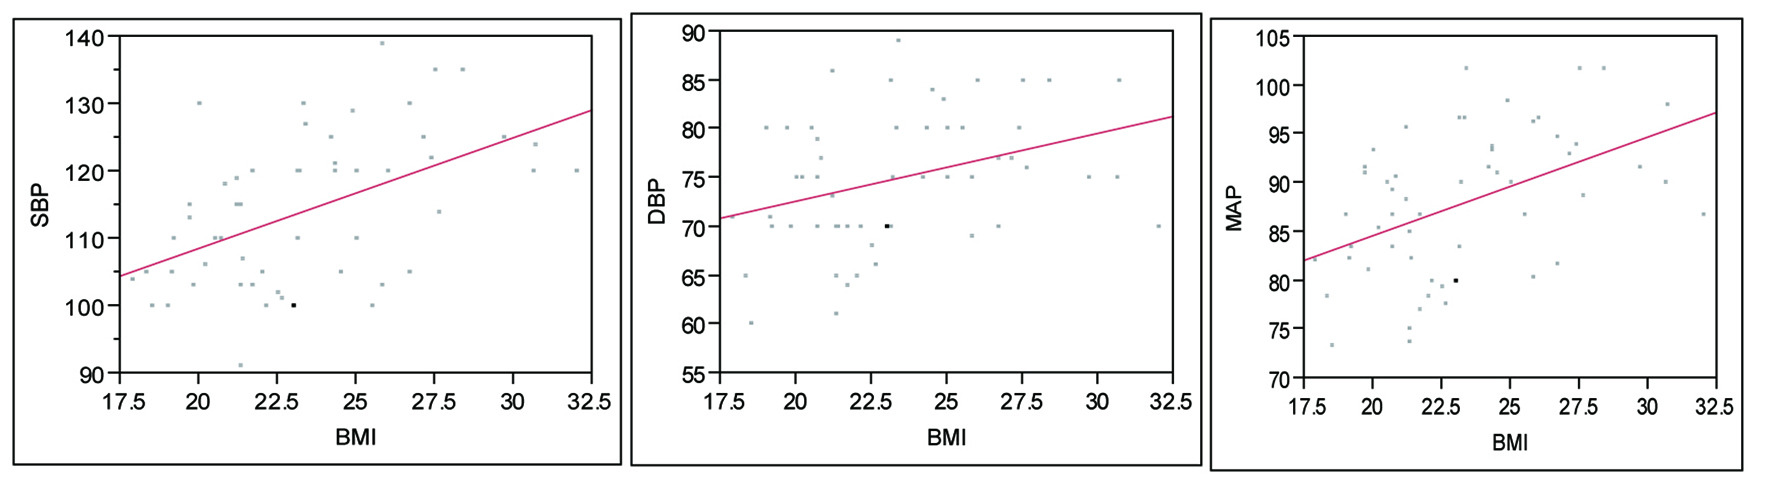 Click for large image | Figure 5. Association between BMI and BP readings in normotensive individuals. SBP: P < 0.0001, R2 = 0.50; DBP: P = 0.008, R2 = 0.34; MAP: P = 0.0003, R2 = 0.27. |
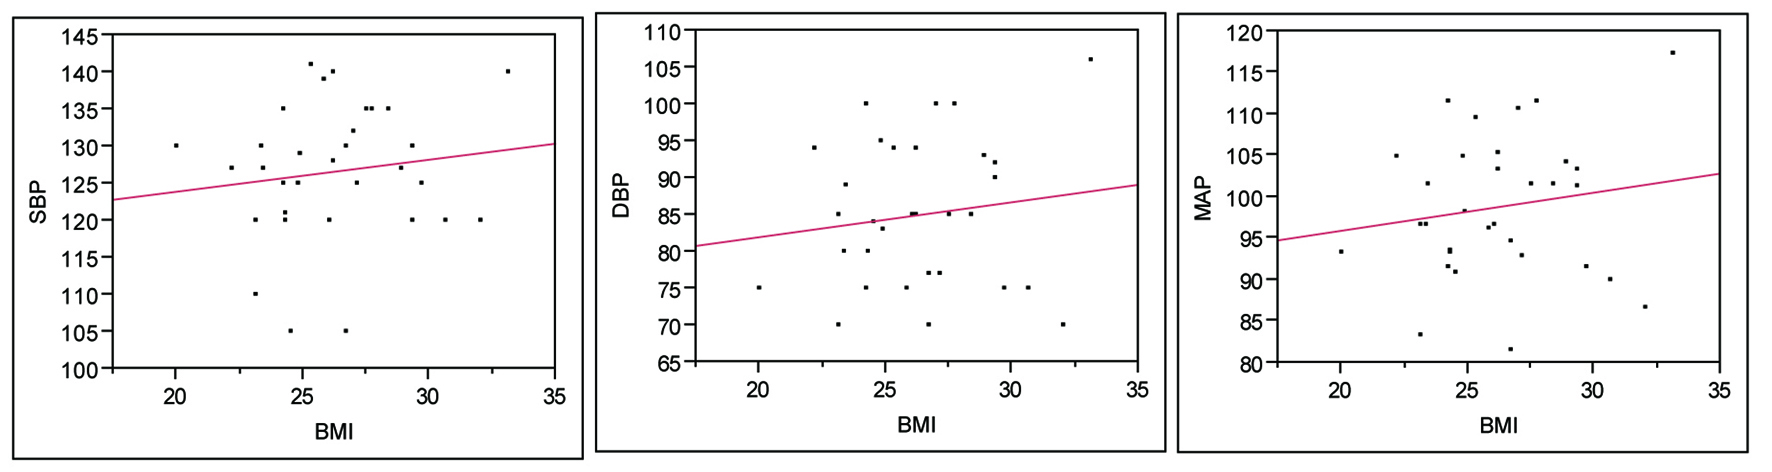
After excluding obese and overweight patients, we found that even a small increase of BMI in these otherwise normal patients is associated with an increase in blood pressure readings (Fig. 6).
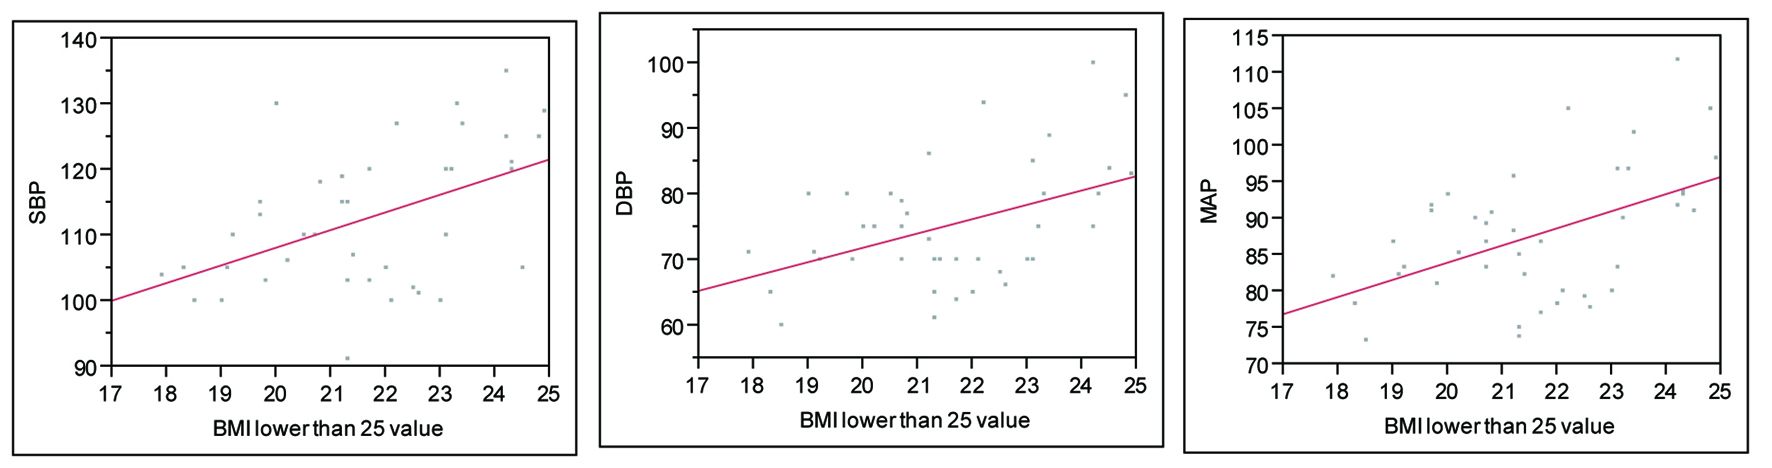 Click for large image | Figure 6. Relationship between BMI and BP in patients without obesity and without overweight. SBP: P = 0.001, R2 = 0.56; DBP: P = 0.002, R2 = 0.51; MAP: P = 0.0007, R2 = 0.56. |
| Discussion | ▴Top |
Body mass index (BMI) is positively and independently associated with morbidity and mortality from hypertension, cardiovascular disease, type II diabetes mellitus and other chronic diseases. Based on this, public policies were developed to prevent overweight and obesity.
The correlation between BMI and hypertension has been demonstrated, both in adults and children. Most of these studies focused on Caucasian populations. Chirinos et al studied the relationship between BMI and Hypertension subtypes and concluded that isolated diastolic hypertension and systo-diastolic hypertension account for most cases of obesity-related hypertension, suggesting that determinants of mean arterial pressure account for the major burden of obesity-related hypertension in US adult men [7, 8].
The effect of increased BMI on BP is superimposed to the known effects of aging in systolic and diastolic BP. Kristjansson et al, in a prospective population study of 1462 women in Sweden, aged 38 - 60 found that after 24 years of follow up, BMI and abdominal circumference at baseline were each independently associated with baseline systolic and diastolic blood pressure. In their study, age, BMI and increments in BMI seemed to be strong predictors for hypertension and increased systolic and diastolic blood pressure in women [9].
The association between BMI and hypertension has been studied in other ethnic groups. This is particularly important, since in the US, Hispanics and Blacks tend to be more commonly affected by hypertension than their Caucasian counterparts. There is also a growing burden of obesity and hypertension in developing countries [10, 11].
Collin et al found that higher BMI was associated with higher prevalence of hypertension in all ethnic groups [12].
Tesfaye et al studied the association between BMI and BP in three populations across Africa and Asia. In their study, the risk of hypertension was higher among population groups with overweight and obesity. BMI was significantly and positively correlated with both SBP and DBP in all the three populations [13]. Kauffman et al studied over 11000 men and women in Africa and the Caribbean and observed a threshold at 21 kg/m2 in the relationship between BMI and BP for women but not for men [14].
We can see in this study that men have a higher BMI than women. In the subgroup analysis, we see than in females increased BMI appears to be more closely related to BP readings than in males. On the other hand, male sex by itself is a risk factor for higher BP readings. Even after adjusting for other risk factors on multivariate analysis, BMI and male sex were risk factors for higher blood pressure readings.
In a study performed in Argentina, Bravo et al found that BMI correlated with both SBP and DBP, with some differences among men and women [15].
In Paraguay, there is limited information on the contribution of body mass index (BMI) to blood pressure (BP). One study showed that the prevalence of overweight and obesity together was of 30.3% [16]. This trend appears to be increasing though, as a more recent study showed that the prevalence of overweight was 38.8% and obesity of 16.6 %. The same study found a prevalence of hypertension of 36.4 % [17].
One could argue that the effect on BP readings in our study could be confounded by age, as it has been shown previously that blood pressure rise with age. With aging, until some point the body mass index also increases, becoming an increasingly strong determinant of blood pressure. We controlled for that factor, as our population is homogeneous in its age.
Hardy et al concluded that weight control throughout life is key to prevention of raised blood pressure during middle age as body-mass index becomes an increasingly strong determinant of blood pressure. This seems to be true in our study. Even in normotensive and non-overweight individuals, small changes in BMI are associated with changes in BP.
Taylor et al studied the relation between body size and 24-hour urine composition for other purposes than ours, but also found that patients with greater BMI excreted more sodium (P < 0.001) [18].
A study made in Bulgaria found a significant positive correlation between 24-hour urine potassium excretion and DBP in obese hypertensive subjects. They concluded that electrolytes in blood and urine were closely related to DBP rather than to SBP, and they confirmed an inverse relation of K intake and BP [19].
The association between dietary intake of K and BP is well known. In our study, there was no relationship of K with BP when taking all patients together. But, when separating those patients with high urinary Na (high sodium intake) from those with lower urinary Na, we saw a trend of higher urinary K associated with lower BP readings (Data not shown).
Another risk factor for hypertension is the socioeconomic milieu. It has been shown that a lower socioeconomic condition is associated with higher blood pressure readings [20]. Our population was composed exclusively of university educated participants, with access to medical care and literature. This of course could also limit the generalization of the study.
Since the BMI cut-off values for obesity were established in different cohorts, we might need to create a more specific set of values for the Paraguayan population, as the values proposed by the American Heart Association are probably rather high for our population.
Based on our results, BMI values of 24.2 and 23.4 were associated with BP of 140/90 and 135/85 respectively. Aggressive prevention of obesity and overweight should be started at a rather early age.
We think that BMI values may add prognostic information on cardiovascular risk factors even at an early age and in patients with a perceived normal weight.
We conclude that increasing BMI values, even without the normal range was associated with higher levels of SBP, DBP and MAP. This finding held true even after adjusting for other risk factors. BMI was also associated with higher urinary excretion of Na, Cl and K.
A main weakness of our study is the relatively small number of participants. Also, the cross-sectional nature of the study limits our interpretation of further associations. Larger studies, with better follow up are needed to confirm this observation.
Conflict of Interest
None of the authors have any conflict of interest to disclose.
| References | ▴Top |
- Bogers RP, Bemelmans WJ, Hoogenveen RT, Boshuizen HC, Woodward M, Knekt P, van Dam RM, et al. Association of overweight with increased risk of coronary heart disease partly independent of blood pressure and cholesterol levels: a meta-analysis of 21 cohort studies including more than 300 000 persons. Arch Intern Med. 2007;167(16):1720-1728.
pubmed doi - World Health Organization. Obesity and Overweight Facts. http://www.who.int/hpr/NPH/docs/gs_obesity.pdf.
- Williamson DF, Kahn HS, Remington PL, Anda RF. The 10-year incidence of overweight and major weight gain in US adults. Arch Intern Med. 1990;150(3):665-672.
pubmed doi - Bays HE, Chapman RH, Grandy S. The relationship of body mass index to diabetes mellitus, hypertension and dyslipidaemia: comparison of data from two national surveys. Int J Clin Pract. 2007;61(5):737-747.
pubmed doi - Clinical Guidelines on the Identification, Evaluation, and Treatment of Overweight and Obesity in Adults—The Evidence Report. National Institutes of Health. Obes Res. 1998;6 Suppl 2:51S-209S.
pubmed - www.mec.gov.py.
- Chirinos JA, Franklin SS, Townsend RR, Raij L. Body mass index and hypertension hemodynamic subtypes in the adult US population. Arch Intern Med. 2009;169(6):580-586.
pubmed doi - Nielsen GA, Andersen LB. The association between high blood pressure, physical fitness, and body mass index in adolescents. Prev Med. 2003;36(2):229-234.
pubmed doi - Kristjansson K, Sigurdsson JA, Lissner L, Sundh V, Bengtsson C. Blood pressure and pulse pressure development in a population sample of women with special reference to basal body mass and distribution of body fat and their changes during 24 years. Int J Obes Relat Metab Disord. 2003;27(1):128-133.
pubmed doi - Resnicow K, Futterman R, Vaughan RD. Body mass index as a predictor of systolic blood pressure in a multiracial sample of US schoolchildren. Ethn Dis. 1993;3(4):351-361.
pubmed - Stevens J, Cai J, Pamuk ER, Williamson DF, Thun MJ, Wood JL. The effect of age on the association between body-mass index and mortality. N Engl J Med. 1998;338(1):1-7.
pubmed doi - Colin Bell A, Adair LS, Popkin BM. Ethnic differences in the association between body mass index and hypertension. Am J Epidemiol. 2002;155(4):346-353.
pubmed doi - Tesfaye F, Nawi NG, Van Minh H, Byass P, Berhane Y, Bonita R, Wall S. Association between body mass index and blood pressure across three populations in Africa and Asia. J Hum Hypertens. 2007;21(1):28-37.
pubmed doi - Kaufman JS, Asuzu MC, Mufunda J, Forrester T, Wilks R, Luke A, Long AE, et al. Relationship between blood pressure and body mass index in lean populations. Hypertension. 1997;30(6):1511-1516.
pubmed - Bravo-Luna M, Orsatti M, Poletto L. [The correlation of arterial pressure with weight and body mass index]. Gac Med Mex. 1999;135(5):463-470.
pubmed - Debs G, La Noval R, Dueñas A, Gozales J. Prevalencia de Factores de riesgo coronario en 10 de octubre. Su evolución a los 5 años. Instituto de Cardiología y Cirugía Cardiovascular. Rev Cubana Cardiología 2001; 15(1):14-20.
- Cabrera M. Prevalencia de la Hipertension Arterial y alteraciones del peso corporal. Revista Electronica de PortalesMedicos.com. 13/04/2007.
- Taylor EN, Curhan GC. Body size and 24-hour urine composition. Am J Kidney Dis. 2006;48(6):905-915.
pubmed doi - Ramshev K, Anev E, Todorova M, Asparukhova D. [Comparative analysis of blood and urinary electrolytes in normotensive and hypertensive normal, overweight and obese subjects aged 50-54 in the Bulgarian army]. Vutr Boles. 2001;33(2-3):9-13.
pubmed - Grotto I, Huerta M, Sharabi Y. Hypertension and socioeconomic status. Curr Opin Cardiol. 2008;23(4):335-339.
pubmed doi
This is an open-access article distributed under the terms of the Creative Commons Attribution License, which permits unrestricted use, distribution, and reproduction in any medium, provided the original work is properly cited.
World Journal of Nephrology and Urology is published by Elmer Press Inc.