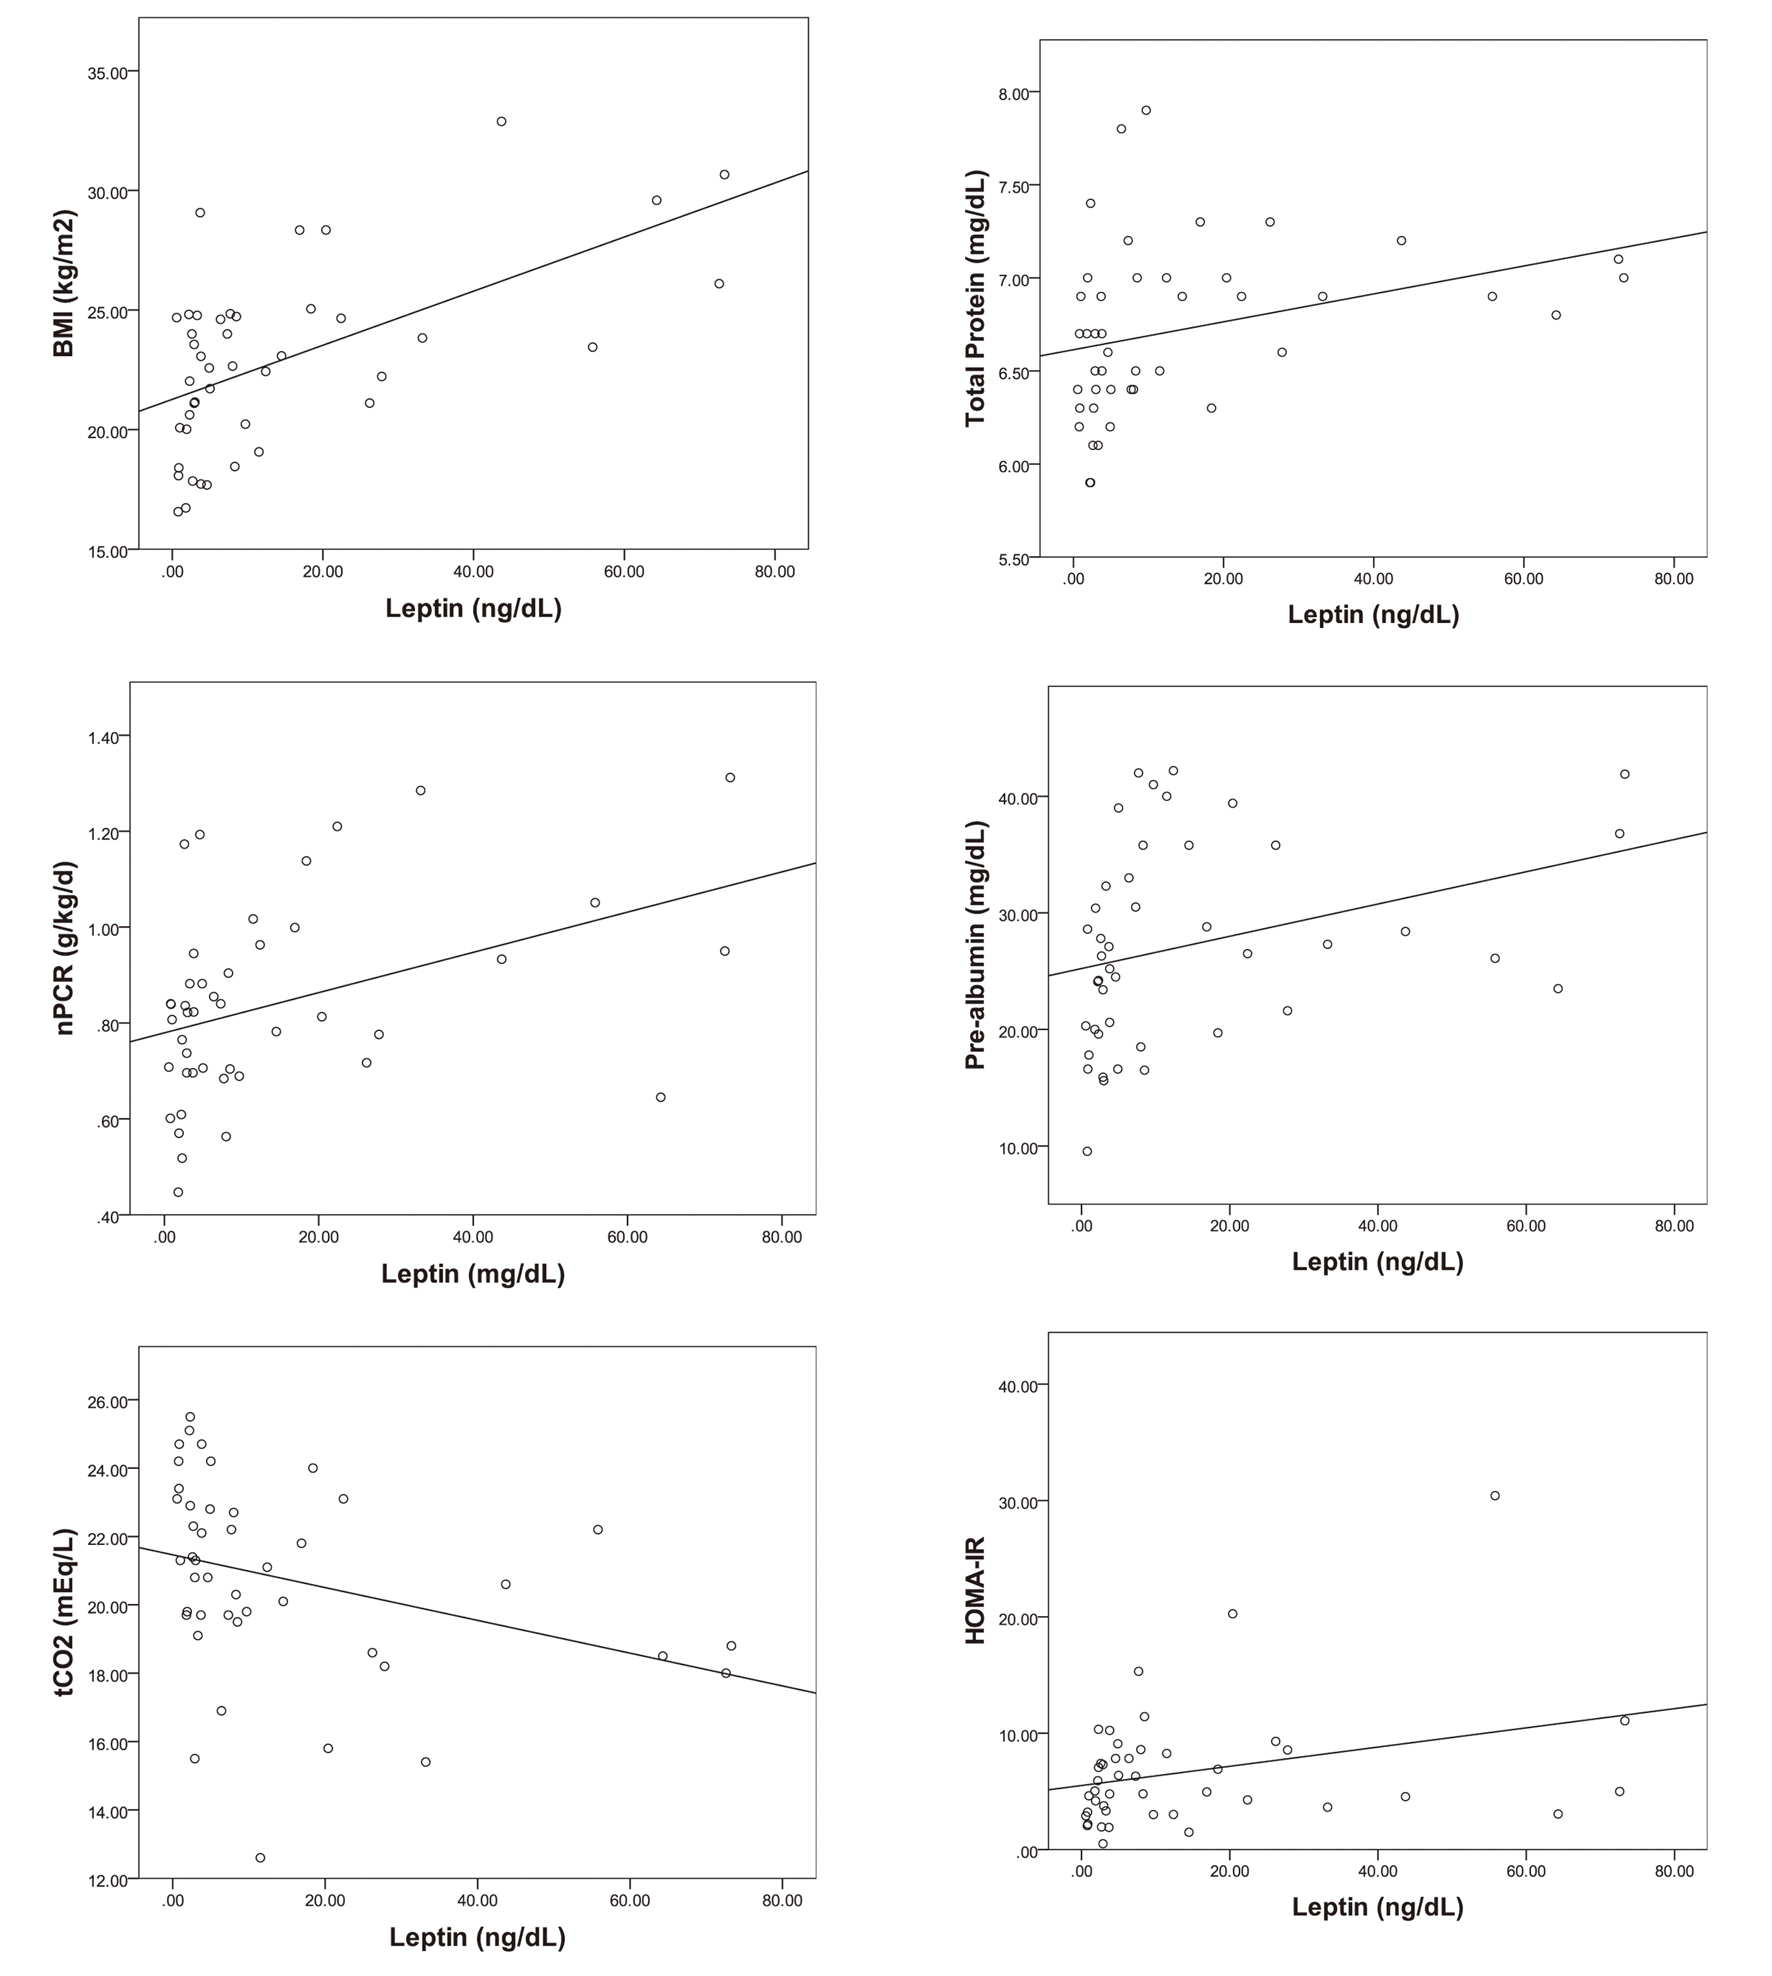
Figure 1. The correlations of serum leptin with BMI, nPCR, tCO2, total protein, pre-albumin and HOMA-IR (P < 0.05).
| World Journal of Nephrology and Urology, ISSN 1927-1239 print, 1927-1247 online, Open Access |
| Article copyright, the authors; Journal compilation copyright, World J Nephrol Urol and Elmer Press Inc |
| Journal website http://www.wjnu.org |
Original Article
Volume 4, Number 2, June 2015, pages 201-206
Relationships of Serum Leptin With Nutrition Status and Insulin Resistance in Non-Diabetic Hemodialysis Patients
Figure
Tables
| Variable | Total (n = 44) | Non-obese (n = 29) | Obese (n = 15) | P value |
|---|---|---|---|---|
| *P < 0.05 (non-obese vs. obese). | ||||
| Age (years) | 52.0 ± 16.1 | 53.7 ± 16.7 | 48.6 ± 14.8 | 0.281 |
| Sex (M/F) | 25/19 | 15/14 | 10/5 | 0.343 |
| Etiologic disease (N) | ||||
| Hypertension | 23 | 15 | 8 | |
| Glomerulonephritis | 10 | 7 | 3 | |
| Polycystic kidney | 3 | 2 | 1 | |
| Unknown | 8 | 5 | 3 | |
| HD duration (months) | 63.7 ± 58.0 | 70.9 ± 64.6 | 49.7 ± 40.6 | 0.393 |
| BMI (kg/m2) | 22.8 ± 3.7 | 20.8 ± 2.3 | 26.8 ± 2.7 | 0.000* |
| Kt/V | 1.4 ± 0.2 | 1.5 ± 0.1 | 1.2 ± 0.1 | 0.000* |
| nPCR (g/kg/day) | 0.8 ± 0.2 | 0.8 ± 0.1 | 0.8 ± 0.2 | 0.528 |
| Hemoglobin (g/dL) | 9.7 ± 1.7 | 9.4 ± 2.0 | 10.2 ± 0.7 | 0.072 |
| Total protein (mg/dL) | 6.7 ± 0.4 | 6.6 ± 0.4 | 6.8 ± 0.5 | 0.291 |
| Albumin (mg/dL) | 3.8 ± 0.4 | 3.8 ± 0.4 | 3.8 ± 0.3 | 0.709 |
| Pre-albumin (mg/dL) | 27.1 ± 8.5 | 26.0 ± 8.6 | 29.3 ± 8.0 | 0.211 |
| Total cholesterol (mg/dL) | 128.0 ± 37.0 | 124.9 ± 33.4 | 133.9 ± 43.6 | 0.480 |
| Triglyceride (mg/dL) | 112.6 ± 66.8 | 101.2 ± 66.5 | 134.6 ± 63.9 | 0.063 |
| HDL-cholesterol (mg/dL) | 36.4 ± 9.1 | 37.9 ± 9.3 | 33.6 ± 8.2 | 0.125 |
| LDL-cholesterol (mg/dL) | 71.8 ± 20.8 | 73.0 ± 22.6 | 69.4 ± 17.1 | 0.766 |
| Calcium (mg/dL) | 9.0 ± 0.8 | 9.1 ± 0.8 | 8.9 ± 0.9 | 0.931 |
| Phosphorus (mg/dL) | 5.1 ± 1.5 | 5.1 ± 1.5 | 5.2 ± 1.5 | 0.795 |
| Ca X P product (mg2/dL2) | 47.0 ± 14.6 | 46.8 ± 14.0 | 47.3 ± 16.1 | 0.776 |
| Uric acid (mg/dL) | 8.1 ± 1.6 | 8.1 ± 1.6 | 8.1 ± 1.6 | 0.901 |
| tCO2 (mEq/L) | 20.7 ± 2.8 | 20.9 ± 2.9 | 20.4 ± 2.7 | 0.334 |
| Creatinine (mg/dL) | 10.8 ± 3.8 | 10.4 ± 3.8 | 11.6 ± 3.0 | 0.353 |
| C-reactive protein (mg/dL) | 0.3 ± 0.5 | 0.4 ± 0.6 | 0.2 ± 0.3 | 0.560 |
| Glucose (mg/dL) | 93.4 ± 10.3 | 92.5 ± 11.0 | 95.2 ± 8.7 | 0.527 |
| Insulin (μU/L) | 28.2 ± 20.0 | 27.1 ± 19.9 | 30.3 ± 20.7 | 0.814 |
| HOMA-IR | 6.6 ± 5.2 | 6.3 ± 5.4 | 7.2 ± 5.1 | 0.629 |
| Homocysteine (μmol/L) | 16.4 ± 4.2 | 16.3 ± 4.5 | 16.7 ± 3.4 | 0.795 |
| Leptin (ng/dL) | 14.2 ± 19.3 | 9.0 ± 12.2 | 24.2 ± 26.1 | 0.030* |
| Bivariate analysis (Spearman’ correlation) | Multivariate analysis | |||
|---|---|---|---|---|
| Correlation coefficient | P value | Standardized coefficient | P value | |
| BMI | 0.528 | 0.000* | 0.446 | 0.003* |
| nPCR | 0.440 | 0.003* | 0.246 | 0.080 |
| Total cholesterol | 0.305 | 0.044* | -0.017 | 0.899 |
| Total protein | 0.473 | 0.001* | 0.051 | 0.794 |
| Albumin | 0.386 | 0.010* | 0.120 | 0.616 |
| Pre-albumin | 0.464 | 0.001* | 0.001 | 0.994 |
| CRP | -0.383 | 0.010* | 0.030 | 0.853 |
| tCO2 | -0.485 | 0.001* | -0.111 | 0.452 |
| Homocysteine | 0.096 | 0.535 | -0.091 | 0.497 |
| HOMA-IR | 0.313 | 0.039* | 0.184 | 0.172 |