World Journal of Nephrology and Urology, ISSN 1927-1239 print, 1927-1247 online, Open Access
Article copyright, the authors; Journal compilation copyright, World J Nephrol Urol and Elmer Press Inc
Journal website http://www.wjnu.org

Original Article

Volume 3, Number 3, September 2014, pages 118-123


Snail Is an Independent Prognostic Indicator for Predicting Recurrence and Progression in Non-Muscle Invasive Bladder Cancer

Figures

Figure 1.
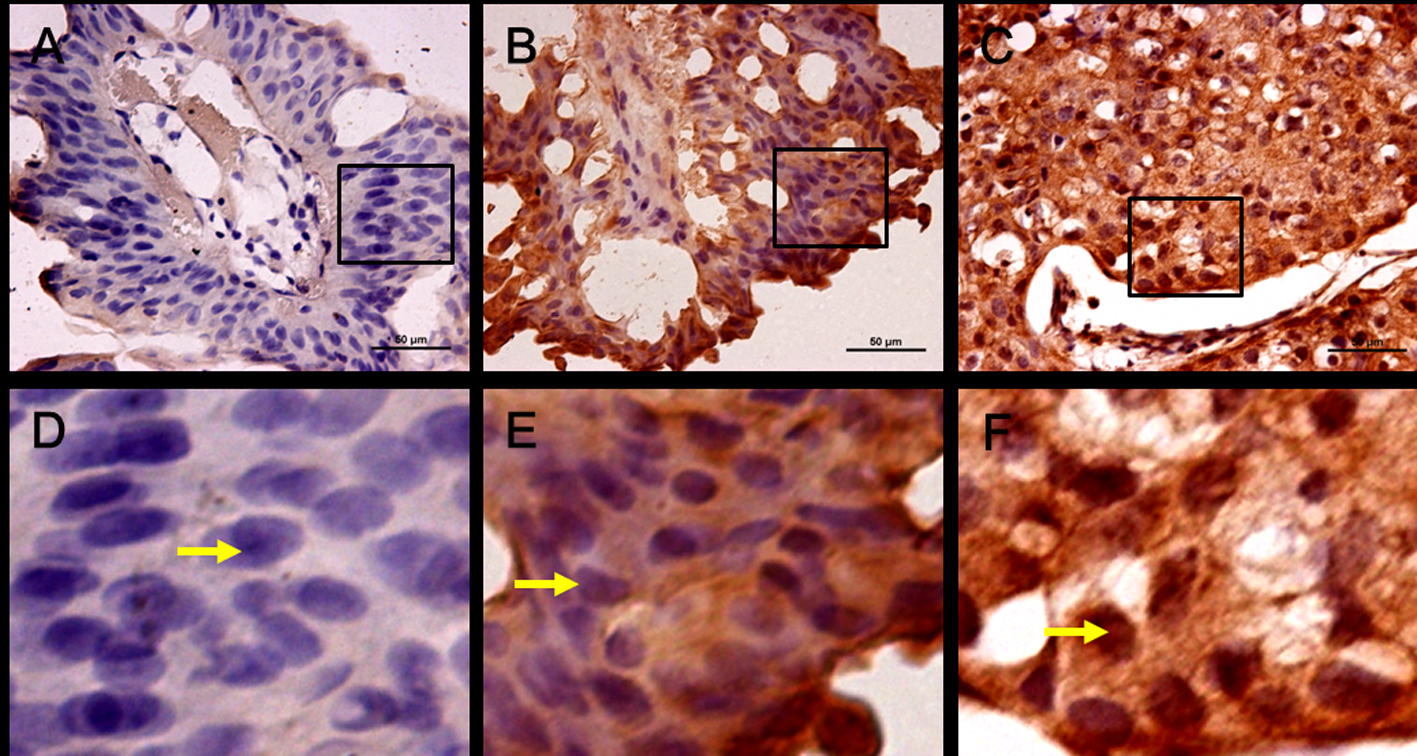
Figure 1. Expression and location of Snail in human bladder cancer. (A) Negative immunostaining for Snail, low grade. (B) Positive Snail immunostaining in cytoplasm, low grade. (C) Positive Snail immunostaining in cytoplasm and nucleus, high grade. (D-F) are part of (A-C) in the rectangle respectively (× 400, scale bar: 50 µm).
Figure 2.
Figure 2. Kaplan-Meier curves show that recurrence-free (A) and progression-free (B) survival rates were significantly higher in high vs. low Snail group (log-rank test P < 0.010 and P < 0.001, respectively).

Tables

Table 1. Association of Snail Expression (Negative vs. Positive) in NMIBC Specimens With Clinical and Pathological Characteristics of 332 Patients Treated With TUR
 
VariableNSnail expression statusP
NegativePositive
Total332228 (68.7%)104 (31.3%)-
Age (years)
  ≤ 65171 (51.5%)119 (75.3%)39 (24.7%)0.013
  > 65161 (48.5%)109 (62.6%)65 (37.4%)
Gender
  Female59 (17.8%)42 (71.2%)17 (28.8%)0.646
  Male273 (82.2%)186 (68.1%)87 (31.9%)
Tumor size
  < 3 cm221 (66.6%)159 (71.9%)62 (28.1%)0.070
  ≥ 3 cm111 (33.4%)69 (62.2%)42 (37.8%)
Number of tumors
  Single205 (61.7%)154 (75.1%)51 (24.9%)0.001
  Multiple127 (38.3%)74 (58.3%)53 (41.7%)
Tumor stage
  Ta204 (61.4%)164 (79.2%)43 (20.8%)< 0.0001
  T1128 (38.6%)64 (51.2%)61 (48.8%)
Tumor grade
  G1114 (34.3%)99 (86.8%)15 (13.2%)< 0.0001
  G2168 (50.6%)110 (65.7%)58 (43.3%)
  G350 (15.1%)18 (36.7%)31 (63.3%)
Concomitant CIS
  No309 (93.1%)217 (70.7%)90 (29.3%)0.006
  Yes23 (6.9%)11 (44.0%)14 (56.0%)
Recurrence
  No213 (64.2%)165 (77.5%)48 (22.5%)< 0.0001
  Yes119 (35.8%)63 (52.9%)56 (47.1%)
Progression
  No292 (88.0%)211 (72.3%)81 (27.7%)< 0.0001
  Yes40 (12.0%)17 (42.5%)23 (57.5%)


Table 2. Univariate Cox Regression Model of Clinical and Pathological Variables Predicting Recurrence and Progression in 332 Patients in Our Cohort
 
VariableRecurrenceProgression
HRP valueHRP value
Age: ≤ 65 years, > 65 years1.1600.4200.7920.469
Gender: male, female1.1020.6821.3270.456
Number of tumors: single, multiple2.609< 0.00011.8400.055
Tumor size: < 3 cm, ≥ 3 cm2.760< 0.00014.6570.0001
T category: Ta, T13.079< 0.00017.953< 0.0001
Grade: G1, G2 vs. G33.566< 0.00018.624< 0.0001
Carcinoma in situ: no, yes2.3910.0025.989< 0.0001
Snail: negative, positive2.976< 0.00014.713< 0.0001


Table 3. Multivariable Cox Regression Model of Clinical and Pathological Variables Predicting Recurrence and Progression in 332 Patients in Our Cohort
 
VariableRecurrenceProgression
HRP valueHRP value
Number of tumors: single, multiple1.91 (1.31, 2.79)0.0011.33 (0.69, 2.58)0.394
Tumor size: < 3 cm, ≥ 3 cm2.11 (1.45, 3.06)< 0.00012.92 (1.48, 5.76)0.002
T category: Ta, T11.64 (1.09, 2.48)0.0182.61 (1.18, 5.73)0.017
Grade: G1, G2 vs. G31.63 (1.03, 2.58)0.0372.36 (1.11, 5.05)0.026
Carcinoma in situ: no, yes1.63 (0.91, 2.91)0.0982.51 (1.08, 5.84)0.033
Snail: negative, positive1.95 (1.33, 2.88)0.0012.34 (1.19, 4.62)0.014