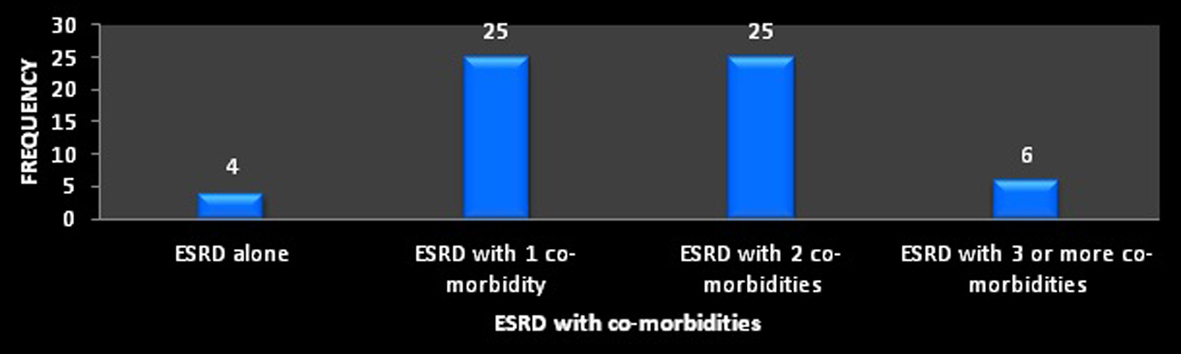
Figure 1. ESRD with co-morbidities.
| World Journal of Nephrology and Urology, ISSN 1927-1239 print, 1927-1247 online, Open Access |
| Article copyright, the authors; Journal compilation copyright, World J Nephrol Urol and Elmer Press Inc |
| Journal website http://www.wjnu.org |
Original Article
Volume 3, Number 4, December 2014, pages 143-150
Impact of Pharmacists’ Counseling on Quality of Life in Patients Undergoing Hemodialysis in a Tertiary Care Teaching Hospital
Figure
Tables
| Demographic details | Frequency | Percentage (%) |
|---|---|---|
| Gender | ||
| Male | 46 | 76.7 |
| Female | 14 | 23.3 |
| Category | ||
| Intervention | 30 | 50 |
| Control | 30 | 50 |
| Age group | ||
| 20 - 29 | 5 | 8.3 |
| 30 - 39 | 16 | 26.7 |
| 40 - 49 | 9 | 15 |
| 50 - 59 | 13 | 21.7 |
| 60 - 69 | 13 | 21.7 |
| 70 - 79 | 4 | 6.7 |
| Marital status | ||
| Married | 56 | 93.3 |
| Single | 4 | 6.7 |
| Employment status | ||
| Employed | 28 | 46.7 |
| Retired | 1 | 1.7 |
| Unemployed | 31 | 51.7 |
| Education | ||
| Illiterate | 17 | 28.3 |
| Up to 10th | 32 | 53.3 |
| 12th | 6 | 10 |
| Graduate | 3 | 5 |
| Post graduate | 2 | 3.3 |
| Hemodialysis per week | ||
| Once | 5 | 8.3 |
| Twice | 45 | 75 |
| Thrice | 10 | 16.7 |
| Vascular access | ||
| Atrioventricular fistula (AVF) | 55 | 91.7 |
| Internal jugular catheter (IJC) | 5 | 8.3 |
| Health insurance | ||
| Yes | 9 | 15 |
| No | 51 | 85 |
| Smoking | ||
| Yes | 8 | 13.3 |
| No | 52 | 86.7 |
| Alcohol use | ||
| Yes | 13 | 21.7 |
| No | 47 | 78.3 |
| Diet | ||
| Mixed | 54 | 90 |
| Veg. | 6 | 10 |
| ESRD with co-morbidities | Frequency | Percentage (%) |
|---|---|---|
| ESRD alone | 4 | 6.7 |
| ESRD with one co-morbidity | 25 | 41.7 |
| ESRD with two co-morbidities | 25 | 41.7 |
| ESRD with three or more co-morbidities | 6 | 10 |
| BNF classification | Frequency | Percentage (%) |
|---|---|---|
| Cardiovascular system | 39 | 65 |
| Central nervous system | 2 | 3.33 |
| Endocrine system | 15 | 25 |
| Gastrointestinal system | 19 | 31.66 |
| Infections | 1 | 1.66 |
| Nutrition and blood | 60 | 100 |
| Domains | Category | Mean | SD | “t” value | P value |
|---|---|---|---|---|---|
| Domain 1 (physical health) | Intervention | 10.43 | 3.89 | 13.98 | < 0.001 |
| Control | 4.67 | 4.45 | |||
| Domain 2 (psychological) | Intervention | 7.03 | 4.53 | 7.01 | < 0.001 |
| Control | 1.20 | 4.55 | |||
| Domain 3 (social relationships) | Intervention | 2.47 | 2.68 | 8.90 | < 0.001 |
| Control | 2.9 | 1.92 | |||
| Domain 4 (environment) | Intervention | 10.87 | 3.58 | 16.81 | < 0.001 |
| Control | 6.20 | 4.25 |
| Domains | Test | Mean | SD | “t” value | P value |
|---|---|---|---|---|---|
| Domain 1 (physical health) | Pre-test | 19.78 | 4.11 | 2.57 | 0.013 |
| Post-test | 22.67 | 8.33 | |||
| Domain 2 (psychological) | Pre-test | 18.88 | 4.01 | 3.68 | < 0.001 |
| Post-test | 21.80 | 4.95 | |||
| Domain 3 (social relationships) | Pre-test | 9.02 | 2.15 | 0.47 | 0.639 |
| Post-test | 8.8 | 3.25 | |||
| Domain 4 (environment) | Pre-test | 23.62 | 3.80 | 1.91 | 0.061 |
| Post-test | 25.95 | 9.22 |