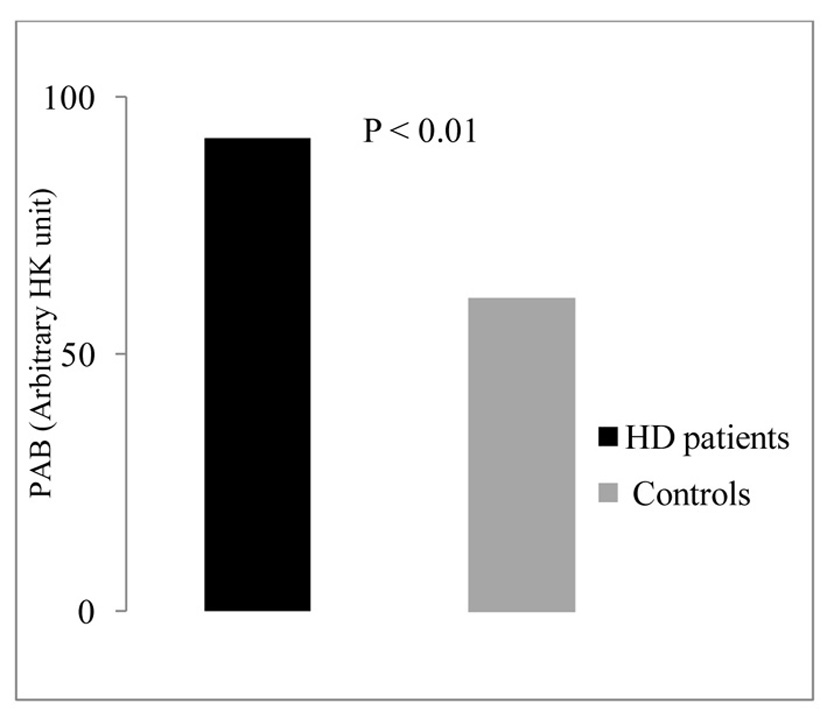
Figure 1. Serum levels of PAB in the studied groups.
| World Journal of Nephrology and Urology, ISSN 1927-1239 print, 1927-1247 online, Open Access |
| Article copyright, the authors; Journal compilation copyright, World J Nephrol Urol and Elmer Press Inc |
| Journal website http://www.wjnu.org |
Original Article
Volume 4, Number 2, June 2015, pages 207-212
Determination of Prooxidant and Antioxidant Balance, Clinical Parameters and Nutrient Intakes in Hemodialysis Patients
Figures
Tables
| Groups | HD patients (mean ± SD) | Controls (mean ± SD) | P |
|---|---|---|---|
| Data were expressed as mean ± SD. NS: non-significant. | |||
| Age (years) | 41.8 ± 14.6 | 38.6 ± 12.5 | NS |
| Sex (M/F) | 18/17 | 15/20 | |
| BMI (kg/m2) | 21.8 ± 2.5 | 25.5 ± 5 | < 0.001 |
| Dialysis duration (months) | 37 (3 - 92) | - | |
| Blood pressure (mm Hg) | |||
| Systolic | 131.2 ± 29 | 121.5 ± 11 | NS |
| Diastolic | 85 ± 13 | 80.2 ± 8.1 | NS |
| Groups | HD patients (mean ± SD) | Controls (mean ± SD) | P |
|---|---|---|---|
| Data were expressed as mean ± SD. BUN: blood urea nitrogen; LDL-C: low density lipoprotein-cholesterol; HDL-C: high density lipoprotein-cholesterol; CRP: C-reactive protein. *The levels were reported as mean ± SEM in HD patients, because the data were not normally distributed. | |||
| BUN* (mg/dL) | 70.4 ± 4.3 | 13 ± 3.4 | < 0.0001 |
| Creatinine* (mg/dL) | 10.7 ± 0.74 | 0.78 ± 0.18 | < 0.0001 |
| Uric acid (mg/dL) | 6.5 ± 1.7 | 4.6 ± 1.5 | < 0.01 |
| Cholesterol* (mg/dL) | 169 ± 14.5 | 169 ± 12.6 | NS |
| LDL-C (mg/dL) | 82.3 ± 26 | 82.3 ± 23.7 | NS |
| HDL-C (mg/dL) | 43.2 ± 15.8 | 42.2 ± 12.5 | NS |
| Triglyceride (mg/dL) | 133.6 ± 90.5 | 119 ± 79.4 | NS |
| Albumin (g/dL) | 4 ± 0.4 | 4.5 ± 0.76 | < 0.01 |
| Sodium (mmol/L) | 140 ± 12 | 139 ± 10 | NS |
| Potassium (mmol/L) | 5.1 ± 0.62 | 4.7 ± 0.9 | NS |
| Calcium (mg/dL) | 8.7 ± 1.1 | 9 ± 1.4 | NS |
| Phosphorous (mg/dL) | 5.2 ± 1.4 | 4.9 ± 1.1 | NS |
| CRP* (mg/L) | 13.6 ± 3 | 2.3 ± 0.19 | < 0.01 |
| Groups | HD patients (mean ± SD) | Controls (mean ± SD) | P |
|---|---|---|---|
| Data were expressed as mean ± SD. $Vitamin A intake was expressed as retinol equivalent (RE). One RE is equal to 1 µg retinol or 6 µg beta-carotene or 12 µg of other provitamin A carotenoids [18]. †The new recommendations for vitamin E are expressed as mg alpha-tocopherol equivalents (mg alpha TE). 1 mg of alpha-tocopherol equals 1.5 IU vitamin E [19]. | |||
| Vitamin A$ (μg/day) | 247 ± 124 | 674 ± 260 | < 0.01 |
| Vitamin B1 (mg/day) | 1.6 ± 0.6 | 1.8 ± 0.8 | NS |
| Vitamin B2 (mg/day) | 1.6 ± 0.63 | 1.9 ± 0.97 | NS |
| Vitamin B6 (mg/day) | 2.9 ± 1.5 | 4.6 ± 1.5 | NS |
| Vitamin B12 (μg/day) | 2.5 ± 0.7 | 3 ± 0.9 | NS |
| Vitamin C (mg/day) | 52 ± 18.8 | 127 ± 81.5 | < 0.01 |
| Vitamin E† (mg/day) | 1.3 ± 0.08 | 7 ± 1.1 | < 0.01 |
| Folate (μg/day) | 124 ± 21.4 | 389 ± 79.4 | < 0.05 |
| Calcium (mg/day) | 494 ± 218 | 814 ± 552 | < 0.01 |
| Phosphorous (mg/day) | 791 ± 280 | 1,249 ± 650 | < 0.0001 |
| Sodium (mg/day) | 1,541 ± 670 | 1,871 ± 919 | NS |
| Potassium (mg/day) | 1,419 ± 529 | 2,500 ± 1,398 | < 0.0001 |
| Iron (mg/day) | 12.8 ± 6.2 | 16.8 ± 8.8 | < 0.05 |
| Zinc (mg/day) | 6.1 ± 2.6 | 9.3 ± 4.3 | < 0.0001 |