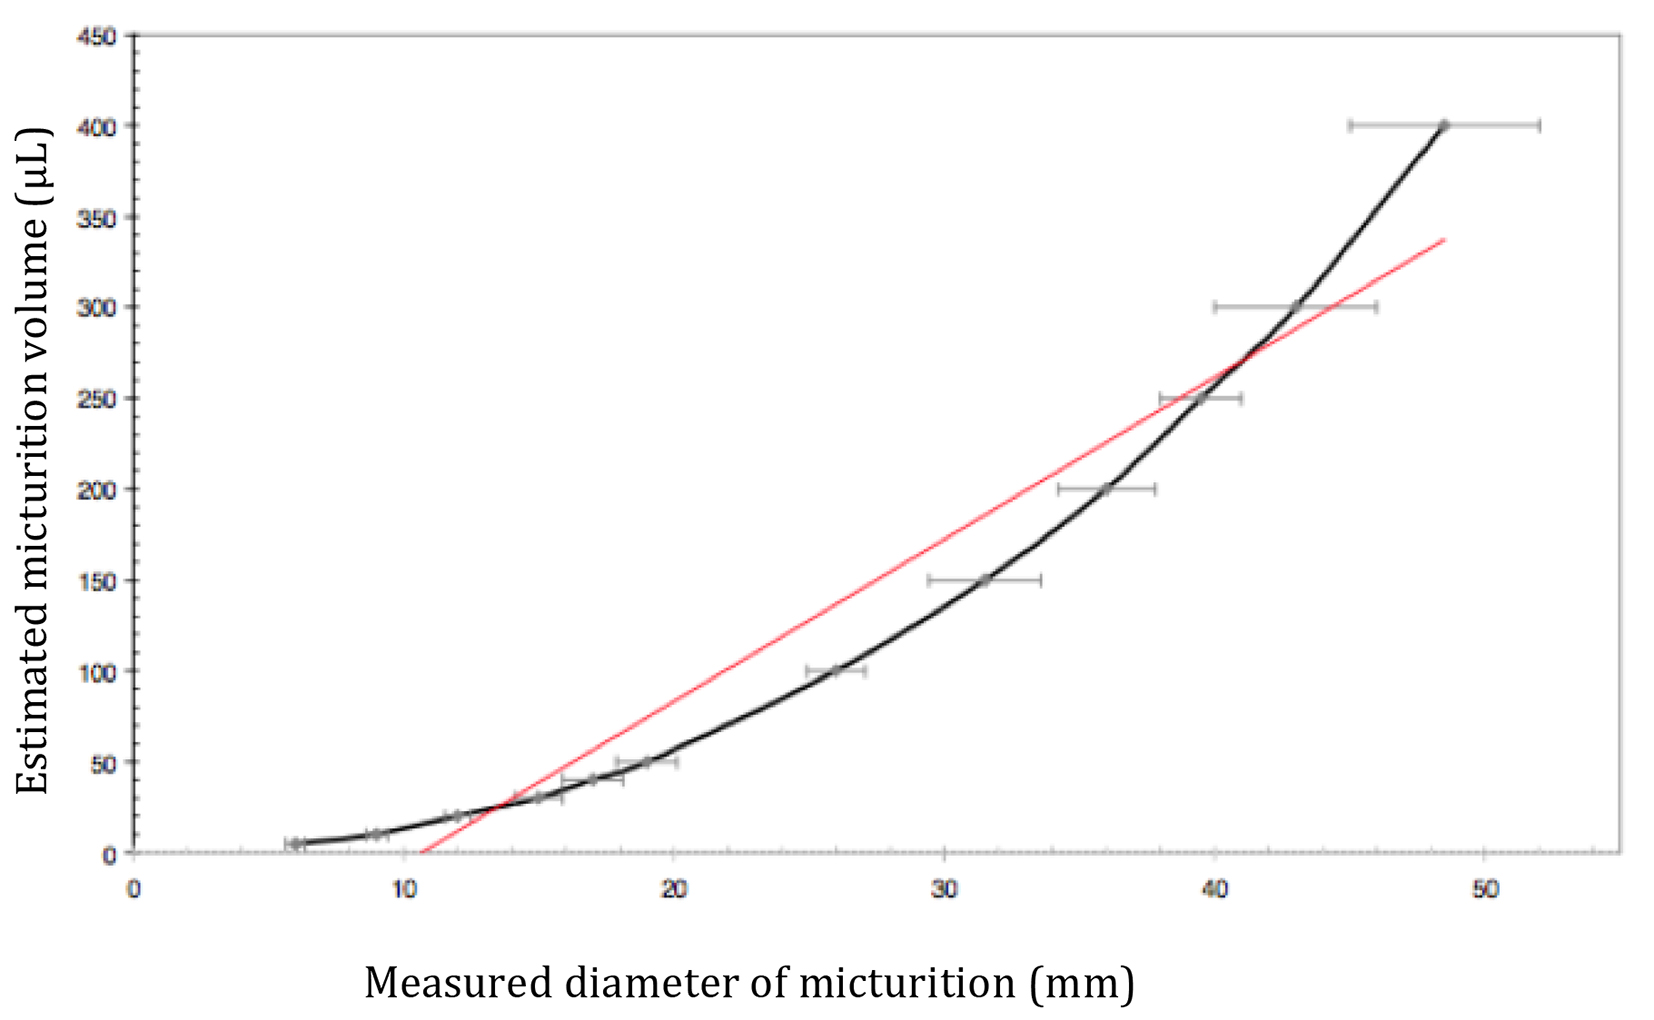
Figure 1. Curve of diameter/micturition volume. Calibration of micturition volume (µL) correlated with diameter of micturition, measured from wet circle on absorbent paper (mm) (mean ± standard deviation). Red line: regression curve.
| World Journal of Nephrology and Urology, ISSN 1927-1239 print, 1927-1247 online, Open Access |
| Article copyright, the authors; Journal compilation copyright, World J Nephrol Urol and Elmer Press Inc |
| Journal website http://www.wjnu.org |
Original Article
Volume 5, Number 1, March 2016, pages 4-10
Voiding Dysfunction in Mice With Experimental Autoimmune Encephalomyelitis: A Multiple Sclerosis-Like Disease
Figures
Table
| Healthy mice | EAE mice | P | |
|---|---|---|---|
| n: number in each group; %: percentage; PVR: postvoid residual urine ; NS: non-significant. | |||
| Mice (n) | 20 | 36 | NS |
| Weight at time of clinical and cystometric investigation (g) | 20.58 ± 0.3 | 16.89 ± 0.24 | 0.0001 |
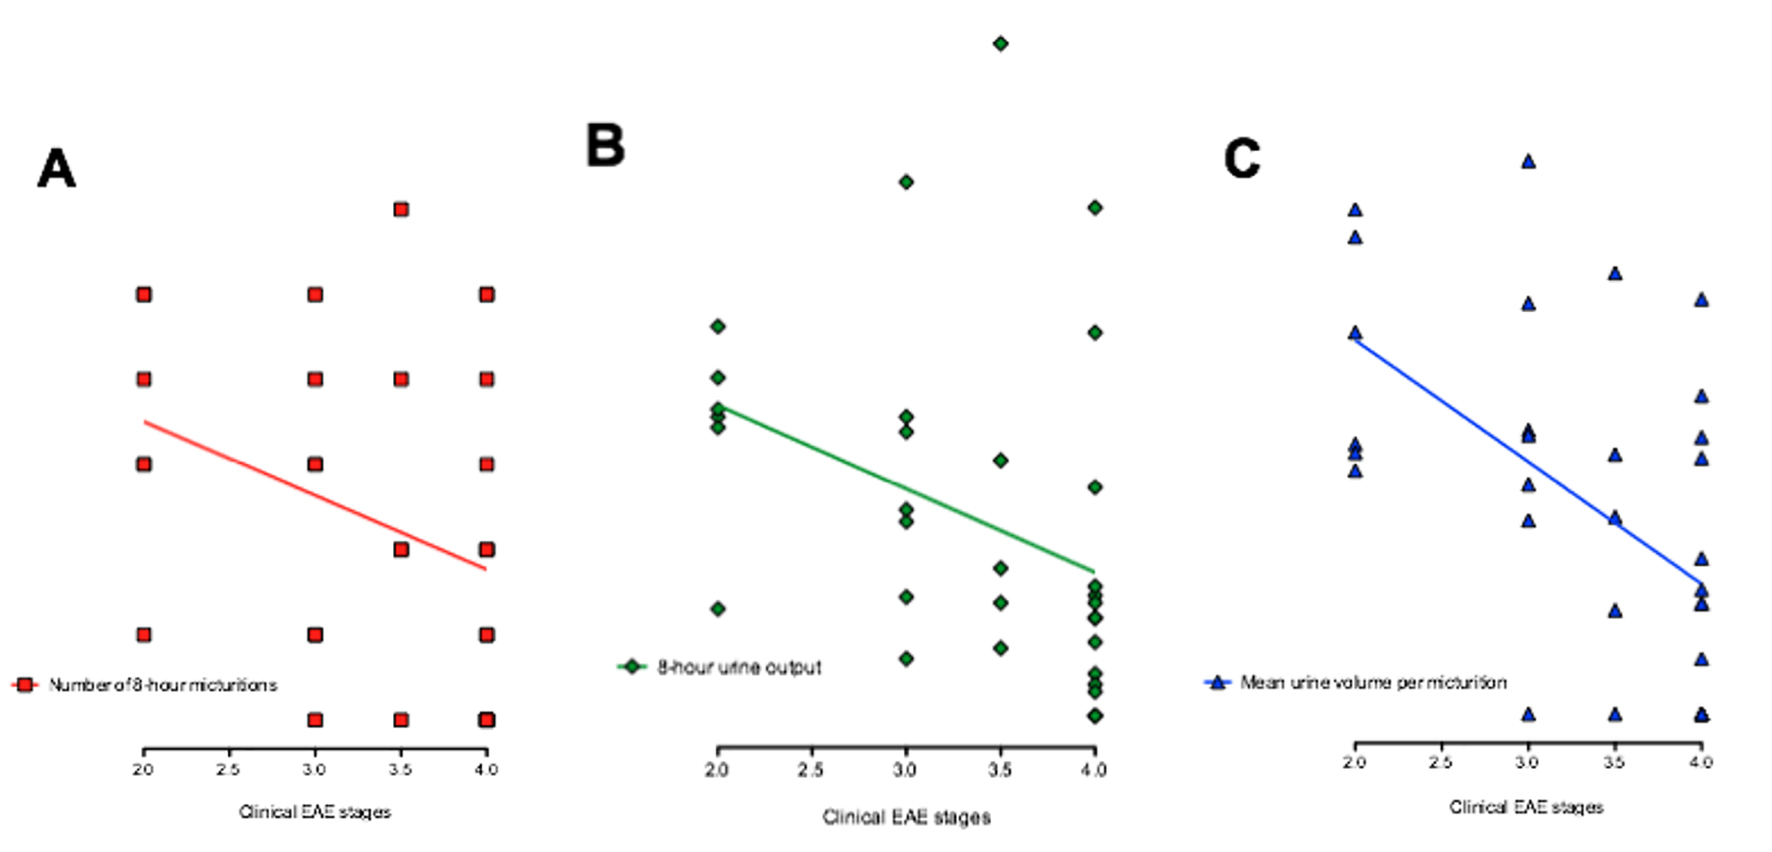
| Micturition diary variables | |||
| 8-h micturitions, (n) | 2.1 ± 0.3 | 2.6 ± 0.2 | NS |
| Total 8-h urine output (µL) | 623 ± 90 | 601 ± 0.2 | NS |
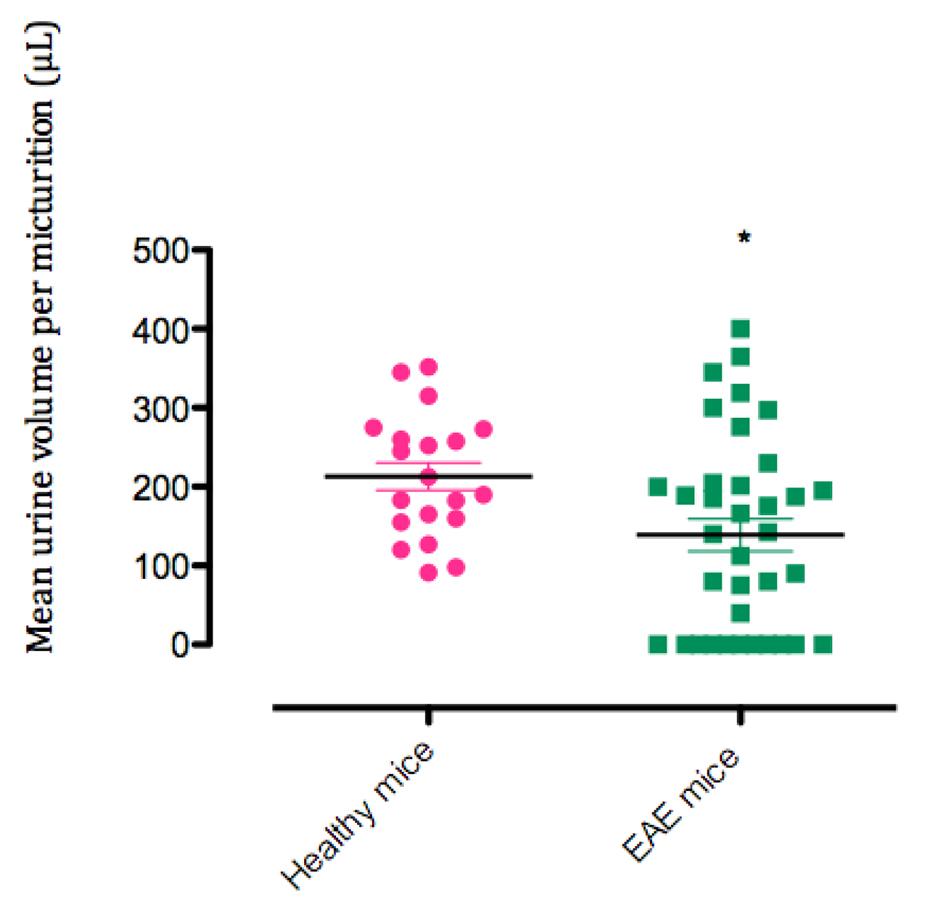
| Mean urine volume per micturition (µL) | 213 ± 17.5 | 138.8 ± 20 | 0.018 |
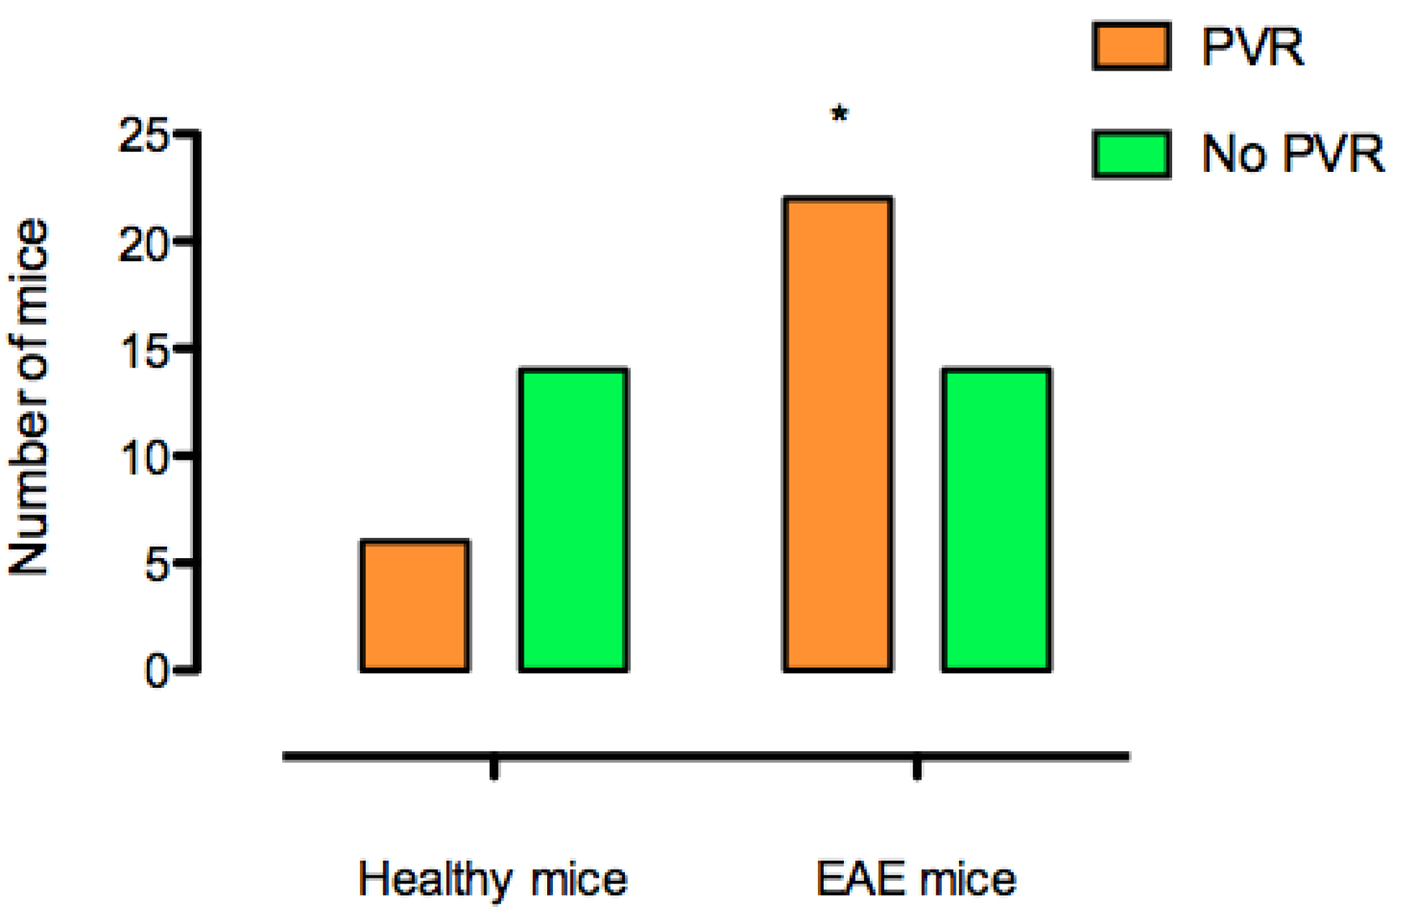
| Persistence of PVR, % (n) | 30 (6/20) | 61 (22/36) | 0.049 |
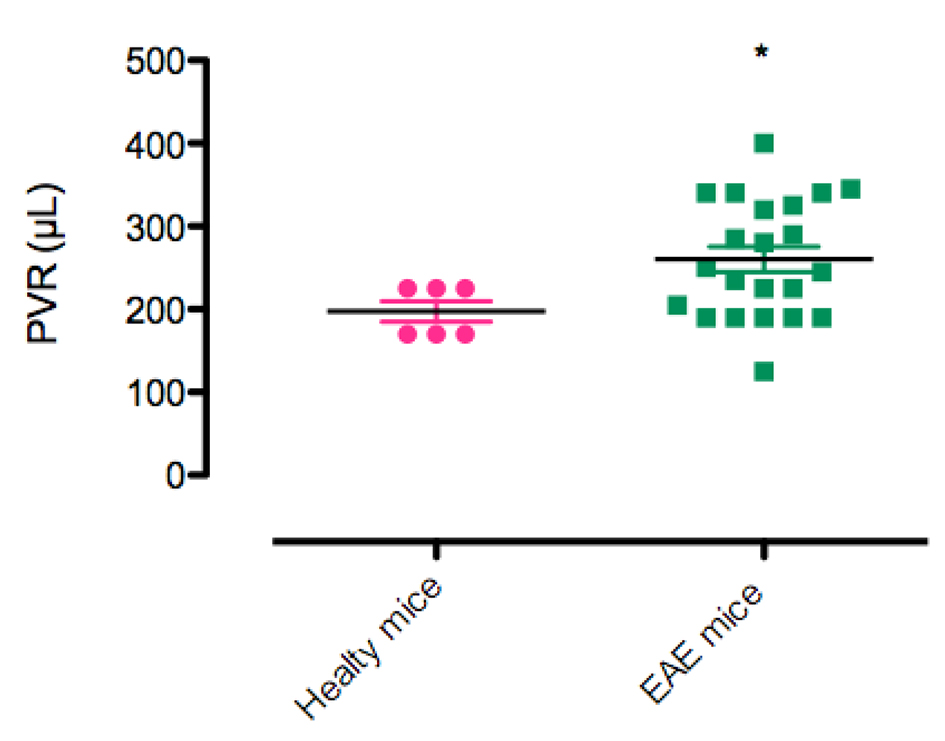
| PVR volume (µL) | 197.5 ± 12 | 260 ± 15 | 0.045 |
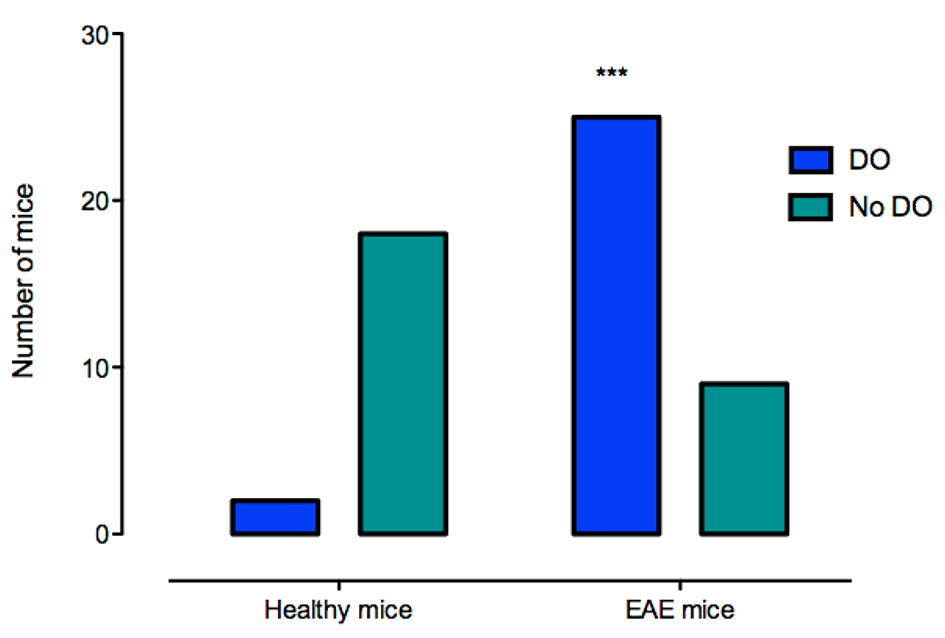
| Cystometric variables | |||
| Detrusor overactivity, % (n) | 10 (2) | 69 (25) | < 0.0001 |
| Area under the curve | 1,632 ± 176 | 2,475 ± 24 | NS |
| Maximum bladder pressure (mm Hg/µL) | 45.7 ± 3 | 46.3 ± 3 | NS |