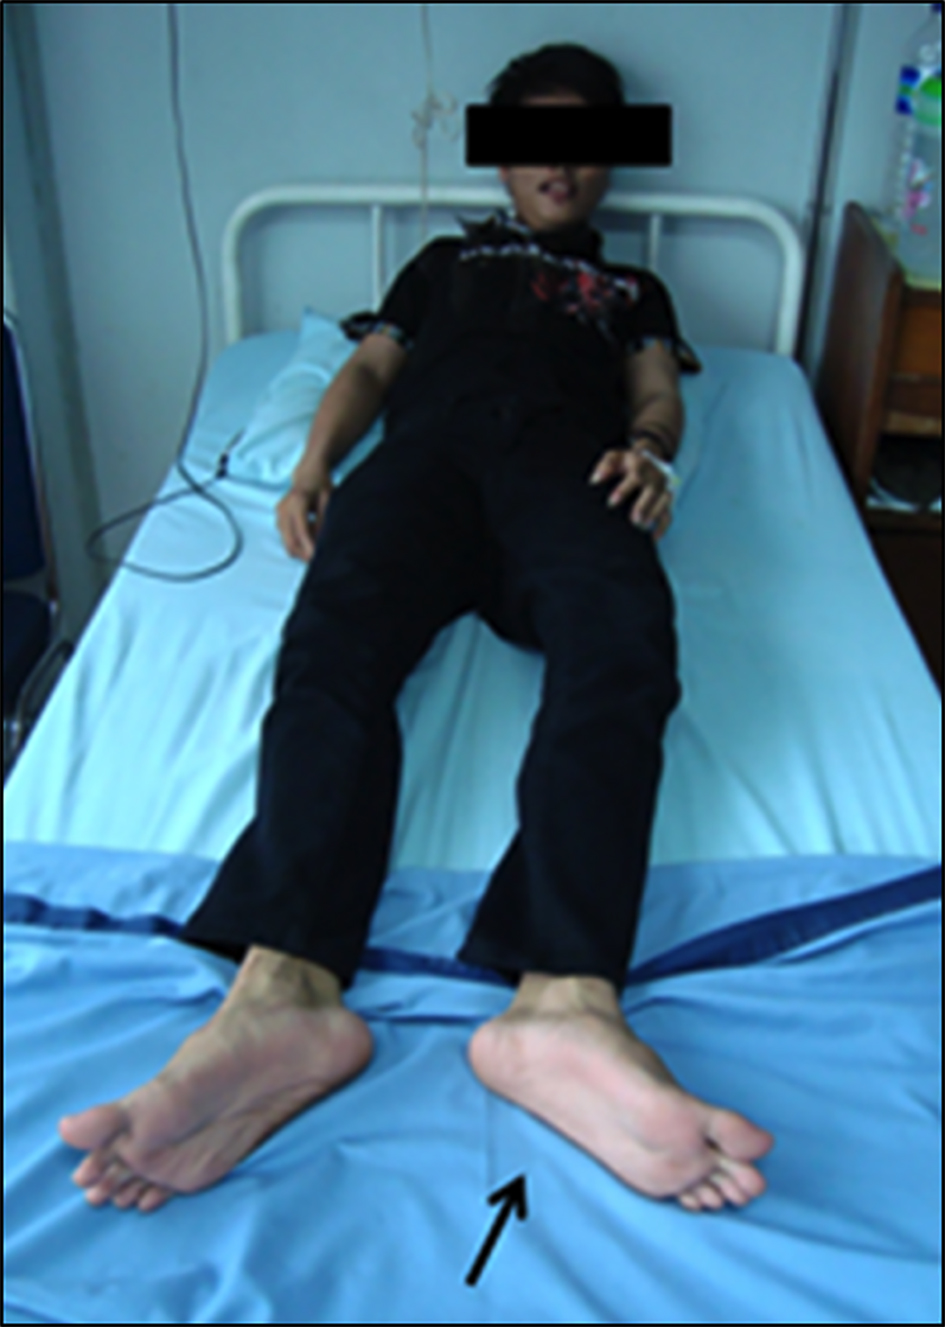
Figure 1. The photograph of the patient, please notice on foot weakness and both legs fell laterally (black arrow).
| World Journal of Nephrology and Urology, ISSN 1927-1239 print, 1927-1247 online, Open Access |
| Article copyright, the authors; Journal compilation copyright, World J Nephrol Urol and Elmer Press Inc |
| Journal website http://www.wjnu.org |
Case Report
Volume 000, Number 000, January 2016, pages 40-47
Gitelman Syndrome: An Important Cause of Severe Hypokalemia and Periodic Paralysis
Figures
Tables
| Investigations | January 16, 2009 (admission) | Third day | First week | Third week (before discharge) | Normal value |
|---|---|---|---|---|---|
| The calculations are: TTKG = ([K] urine/(U/P) osmolality)/[K] plasma; FEK (%) = ([K] urine × [Cr] plasma)/([Cr] urine × [K] plasma). NT: not tested; TSHs: sensitive thyroid stimulating hormone; PAC: plasma aldosterone concentration; PRA: plasma renin activity, PCO2: partial pressure of carbon dioxide; FEK: excretion fraction of potassium; TTKG: transtubular potassium concentration gradient. aFrom reference: Elisaf M and Siamopoulos KC (Postgrad Med J 1995). bFutrakul et al (Am J Kidney Dis 1999). cBettinelli A, et al (J Pediatr 1992). *Abnormal value. | |||||
| Plasma electrolyte | |||||
| Sodium | 138.2 | 135.4 | 139.3 | 137 | 135 - 145 mEq/L |
| Potassium* | 1.5 | 3.2 | 2.1 | 3.6 | 3.5 - 5.0 mEq/L |
| Chloride | 90.0 | 86.0 | 96.0 | 92.0 | 95 - 110 mEq/L |
| Calcium | 9.2 | 10.3 | 9.0 | 9.4 | 9.0 - 10.2 mEq/L |
| Magnesium* | 1.3 | 1.0 | 1.8 | 2.1 | 1.9 - 7.4 mEq/L |
| Creatinine | 0.82 | 0.76 | 0.91 | 0.88 | 0.7 - 1.4 mg/dL |
| Plasma osmolality | 289.5 | 287.5 | 294.7 | 291 | 285 - 295 mOsm/kg |
| CPK* | 1,236 | 748 | 314 | 55 | 29 - 200 IU/L |
| Endocrine evaluation | |||||
| Triiodothyronine | NT | 1.12 | NT | NT | 0.8 - 2.0 ng/mL |
| Free thyroxine | NT | 120.5 | NT | NT | 60 - 120 mMol/L |
| TSHs | NT | 2.6 | NT | NT | 0.3 - 5.0 IU/mL |
| Plasma aldosterone* | NT | NT | 93.0 | NT | < 15 ng/dL |
| PRA* | NT | NT | 17.8 | NT | 0.7 - 3.3 ng/mL/h |
| PAC/PRA ratio | NT | NT | 5.2 | NT | < 30 |
| Blood gas analysis | |||||
| pH* | 7.5 | NT | 7.4 | NT | 7.35 - 7.45 |
| PCO2 | 32 | NT | 37 | NT | 35 - 45 mm Hg |
| Bicarbonate* | 31.3 | NT | 25 | NT | 18 - 23 mEq/L |
| Base excess* | 11.7 | NT | 4.4 | NT | ± 2.5 |
| Urine electrolyte excretion per 24 h | |||||
| Sodium* | NT | 402.0 | 164.9 | 173.0 | 60 - 220 mEq |
| Potassium* | NT | 41.8 | 32.4 | 21.7 | < 10 mEq |
| Urine osmolality | NT | 542 | 651 | 363 | 250 - 900 mOsm/kg |
| FEK* | NT | 29.4 | NT | 22.6 | 9.6% (4.6 - 20.4)a |
| TTKG* | NT | 6.9 | NT | 8.2 | 6.0 (4.1 - 10.5)b |
| Chloride* | NT | 281.0 | 184.0 | 158.0 | 60 - 200 mEq |
| Calcium* | NT | 19.2 | 16.9 | 96.9 | 50 - 400 mg/g cr |
| Creatinine | NT | 33.6 | NT | 41.5 | 25 - 400 mg/dL |
| Calcium/creatinine ratio* | NT | 0.04 | NT | 0.23 | ≥ 0.2 mg/mgc |
| CH2O (mL/min) | CCl (mL/min) | FENa (%) | FEK (%) | FECl (%) | DFCR (%) | FDDC (%) | |
|---|---|---|---|---|---|---|---|
| Uosm: urinary osmolality; CH2O: maximal free water clearance; CCl: chloride clearance; FeNa: fractional excretion of sodium; FEK: fractional excretion of potassium; FECl: fractional excretion of chloride; DFCR: distal fractional chloride reabsorption; FDDC: fractional distal delivery of chloride. The parameter used are: 1) solute-free water clearance (CH2O) = V × (1 - Uosm/Posm), where V is urine flowrate in mL/min, Uosm is urine osmolality, and Posm is plasma osmolality; 2) chloride clearance (CCl) = V × UCl/PCl, where UCl is urinary chloride concentration, and PCl is plasma chlorid concentration; 3) distal fractional chloride reabsorption (DFCR) = CH2O/[CH2O + CCl]; 4) fractional distal delivery of chloride (FDDC) = [CH2O + CCl]/creatinine clearance; 5) fractional excretion of solute (FEX) = 100 × [Ux/Px] × [Pcr/Ucr], where Pcr is plasma creatinine concentration, and Ucr is urinary creatinine concentration. X was taken for Na, K and Cl. | |||||||
| Basal | 5.6 | 1.7 | 2.49 | 31.5 | 2.1 | 83.4 | 18.2 |
| Thiazide | 6.7 | 2.1 | 12.1 | 59.6 | 7.5 | 78.4 | 30.8 |
| Furosemide | 1.1 | 20.4 | 26.2 | 72.5 | 30.5 | 7.2 | 51.8 |