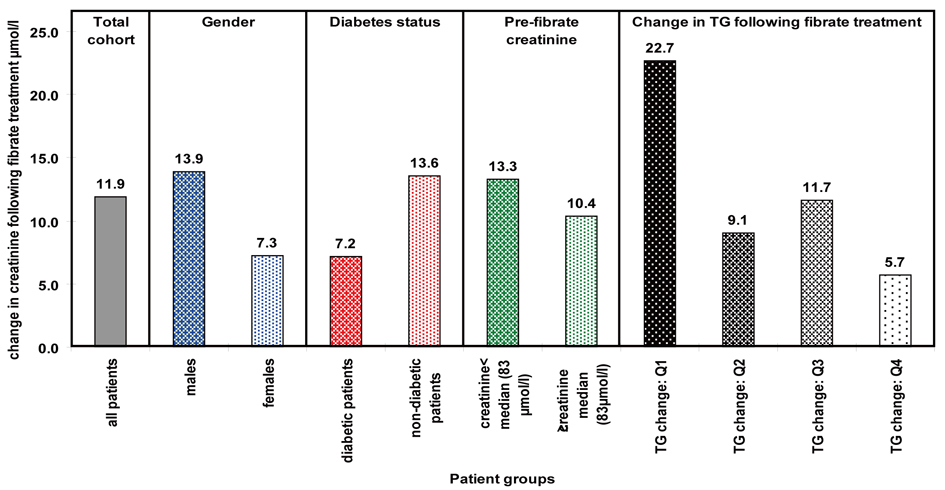
Figure 1. Mean change in creatinine seen within significantly associated factors.
| World Journal of Nephrology and Urology, ISSN 1927-1239 print, 1927-1247 online, Open Access |
| Article copyright, the authors; Journal compilation copyright, World J Nephrol Urol and Elmer Press Inc |
| Journal website http://www.wjnu.org |
Original Article
Volume 1, Number 2-3, June 2012, pages 51-58
Factors Associated With Fibrate-Induced Creatinine Elevation: Observations in an Outpatient Setting
Figure
Tables
| Pre Treatement Creatinine (µmol/L) | Post Treatement Creatinine (µmol/L) | Paired t test | ||||||||
|---|---|---|---|---|---|---|---|---|---|---|
| n | Mean | sd | Min / Max | Median | Mean | sd | Min / Max | Median | P | |
| Total | 132 | 81.9 | 17.3 | 33 / 127 | 83.0 | 93.8 | 20.4 | 52 / 143 | 91.0 | 0.0001 |
| Male | 92 | 85.7 | 17.2 | 33 / 127 | 85.5 | 99.6 | 19.0 | 70 / 143 | 97.0 | 0.0001 |
| Female | 40 | 73.2 | 14.1 | 35 / 106 | 73.5 | 80.5 | 17.2 | 52 / 128 | 82.0 | 0.0026 |
| Diabetic | 34 | 82.1 | 14.1 | 59 / 121 | 85.0 | 89.2 | 18.0 | 53 / 139 | 88.0 | 0.0004 |
| Non-Diabetic | 97 | 81.9 | 18.4 | 33 / 127 | 83.0 | 95.4 | 21.1 | 52 / 143 | 93.0 | 0.0001 |
| On statin treatment | 58 | 80.6 | 16.8 | 33 / 117 | 82.0 | 90.4 | 16.8 | 53 / 141 | 87.5 | 0.0001 |
| Not on statin treatment | 74 | 83.0 | 17.7 | 33 / 127 | 83.0 | 96.5 | 22.6 | 52 / 143 | 93.0 | 0.0001 |
| Factor | N | coefficient | 95% Confidence Interval | P | |
|---|---|---|---|---|---|
| Model 1 | |||||
| Male | 132 | 6.64 | 1.0 / 12.3 | 0.022 | |
| Pre treatement Creatinine | 132 | -0.20 | -0.3 / -0.1 | 0.011 | |
| Age | 129 | 0.04 | -0.3 / 0.2 | 0.782 | |
| Diabetes | 131 | -6.37 | -12.4 / -0.4 | 0.037 | |
| Duration of treatment | 124 | 1.70 | -6.5 / 3.1 | 0.482 | |
| Statin treatment | 132 | -3.78 | -9.1 / 1.5 | 0.16 | |
| Model 2 | |||||
| Change in TC levels | 109 | 0.54 | -1.68 / 2.77 | 0.63 | |
| Change in TG levels | 109 | -1.37 | -2.43 / -0.32 | -0.011 | |
| Change in HDL-C levels | 109 | -6.53 | -6.30 / 19.36 | 0.32 | |