World Journal of Nephrology and Urology, ISSN 1927-1239 print, 1927-1247 online, Open Access
Article copyright, the authors; Journal compilation copyright, World J Nephrol Urol and Elmer Press Inc
Journal website http://www.wjnu.org

Original Article

Volume 7, Number 2, June 2018, pages 39-44


Balanced Crystalloid Solution Versus Normal Saline on Biochemical Outcomes in Acute Medical and Surgical Patients

Figures

Figure 1.
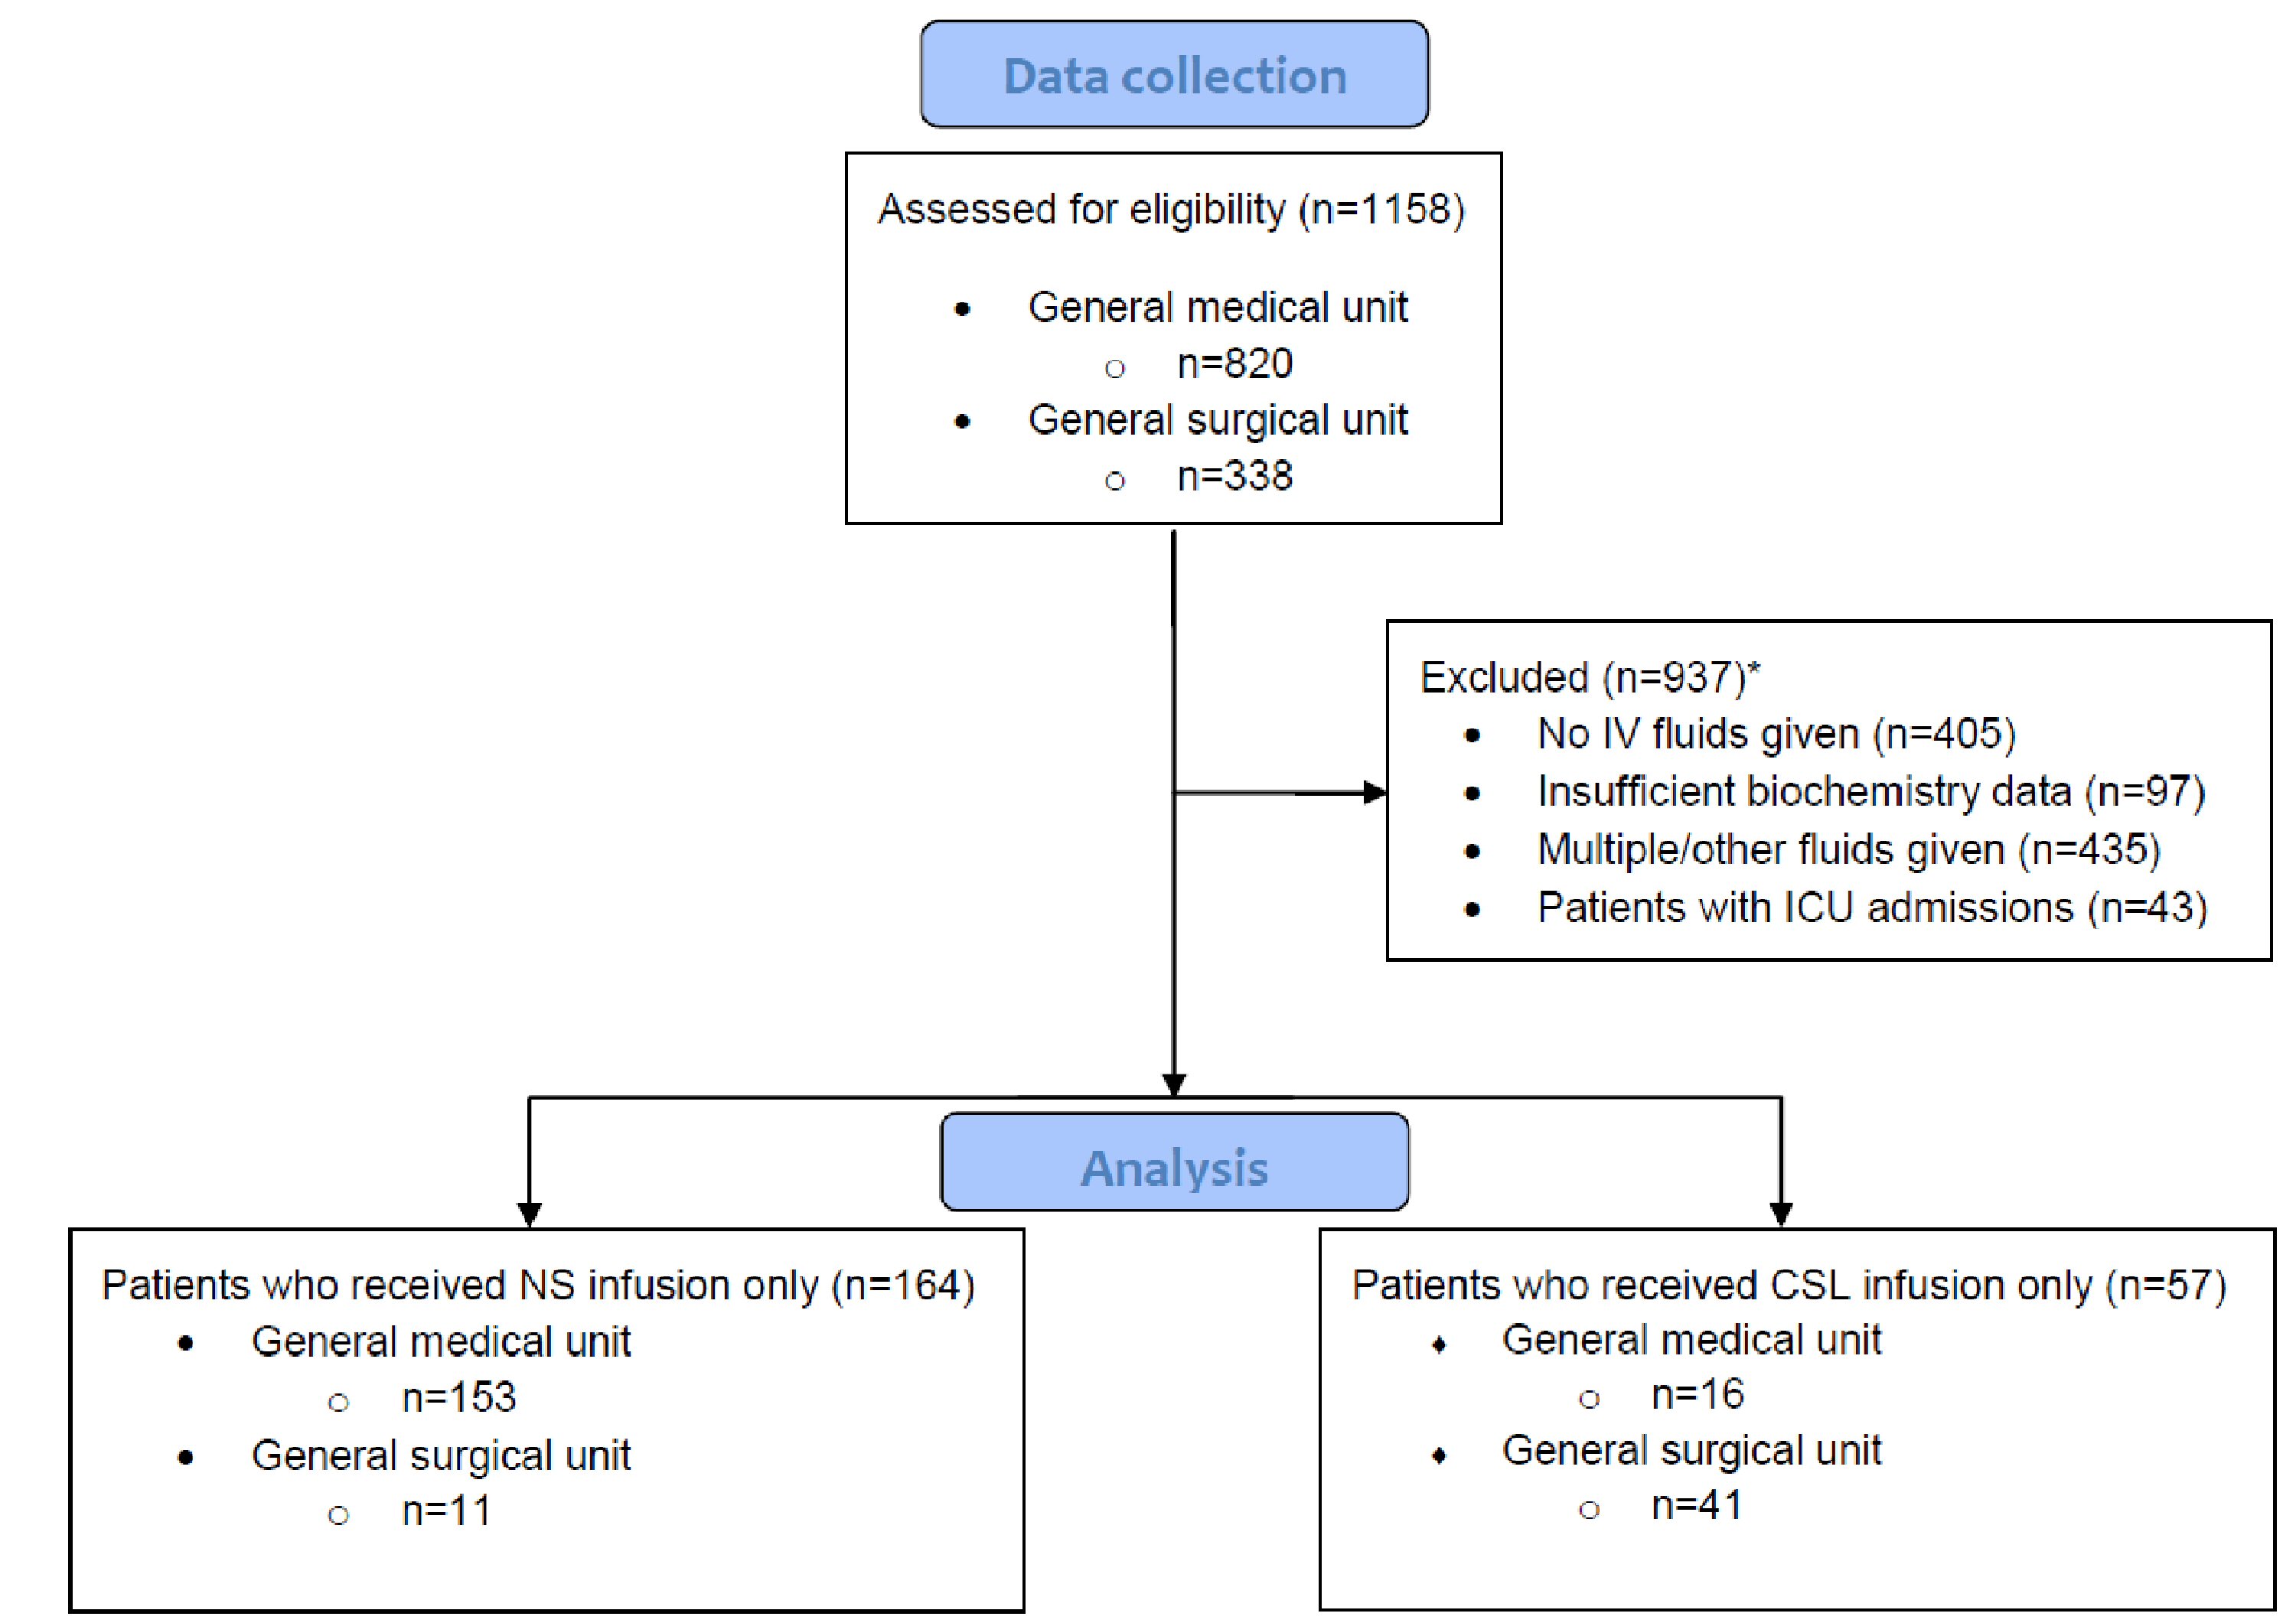
Figure 1. Criteria used for exclusion to obtain list of patients for final analysis. *Number of patients satisfying each exclusion criteria overlapped with other criteria. In total, there were 937 patients excluded from this study. CSL: compound sodium lactate; ICU: intensive care unit; IV: intravenous; NS: normal saline.
Figure 2.
Figure 2. Post-infusion mean values of electrolytes between NS and CSL cohorts. There were no significant differences in the mean values of serum sodium, chloride and bicarbonate post-infusion of both normal saline and compound sodium lactate.

Tables

Table 1. Characteristics of Patients Who Received Intravenous Fluids During Their Admission
 
DemographicsFluid infusion givenAll patients (n = 221)P-value
NS (n = 164)CSL (n = 57)
SD: standard deviation; ACEI: ACE inhibitor; ARB: angiotensin II receptor blocker; NSAID: non-steroidal anti-inflammatory drug. The specific ACEIs (ramipril, perindopril, fosinopril, enalapril), ARBs (candesartan, irbesartan, telmisartan, olmesartan), and NSAIDs (aspirin, ibuprofen, celecoxib, diclofenac) were also recorded.
Age, mean (SD), year76.4 (17.5)57.9 (21.6)71.6 (20.3)< 0.0001
Men62 (37.8%)22 (38.6%)84 (38.0%)0.9155
Admitting unit
  Medical153 (93.3%)16 (28.1%)169 (76.5%)< 0.0001
  Surgical11 (6.7%)41 (71.9%)52 (23.5%)< 0.0001
Comorbidities
  Hypertension79 (48.2%)18 (31.6%)97 (43.9%)0.0297
  Ischemic heart disease32 (19.5%)5 (8.8%)37 (16.7%)0.0614
  Diabetes mellitus46 (28.0%)12 (21.1%)58 (26.2%)0.3010
  Chronic respiratory disease30 (18.3%)9 (15.8%)39 (17.6%)0.6693
Medications
  ACEI/ARBs58 (35.4%)10 (17.5%)68 (30.8%)0.0651
  NSAIDs62 (37.8%)10 (17.5%)72 (32.6%)0.0049
  Loop diuretics56 (34.1%)9 (15.8%)65 (29.4%)0.0088
  Thiazide diuretics9 (5.5%)4 (7.0%)13 (5.9%)0.6724
  Potassium sparing diuretics11 (6.7%)3 (1.8%)12 (5.4%)0.6998


Table 2. Post-Infusion Mean Serum Electrolyte Values Comparing Normal Saline and Compound Sodium Lactate Infused Patients
 
BiochemistryConcentration (mmol/L) ± SD
NSCSLP-value
CSL: compound sodium lactate; NS: normal saline; SD: standard deviation.
Medical(n = 153)(n = 16)
  Serum sodium139.2 ± 4.7140.0 ± 4.00.5127
  Serum chloride98.9 ± 5.299.4 ± 5.50.7163
  Serum bicarbonate26.9 ± 3.627.0 ± 3.60.9159
Surgical(n = 11)(n = 41)
  Serum sodium140.9 ± 3.7140.1 ± 2.10.3511
  Serum chloride100.6 ± 3.4100.2 ± 2.20.6378
  Serum bicarbonate26.7 ± 3.327.5 ± 2.50.3834
All patients(n = 164)(n = 57)
  Serum sodium139.3 ± 4.6140.1 ± 2.70.2164
  Serum chloride99.0 ± 5.1100.0 ± 3.40.1700
  Serum bicarbonate26.9 ± 3.627.4 ± 2.80.3418


Table 3. Summary Statistics of Patient Outcomes Broken Down by Fluid Infusion Received
 
OutcomesNo.
NS (n = 164)CSL (n = 57)P-value
KDIGO: Kidney Disease: Improving Global Outcomes clinical practice guideline 2009.
Length of stay, mean (SD), days5.8 (4.9)3.5 (2.2)0.0007
Acute kidney injury (KDIGO)10 (6.1%)0 (0.0%)0.0564
Death during admission6 (3.7%)0 (0.0%)0.1432