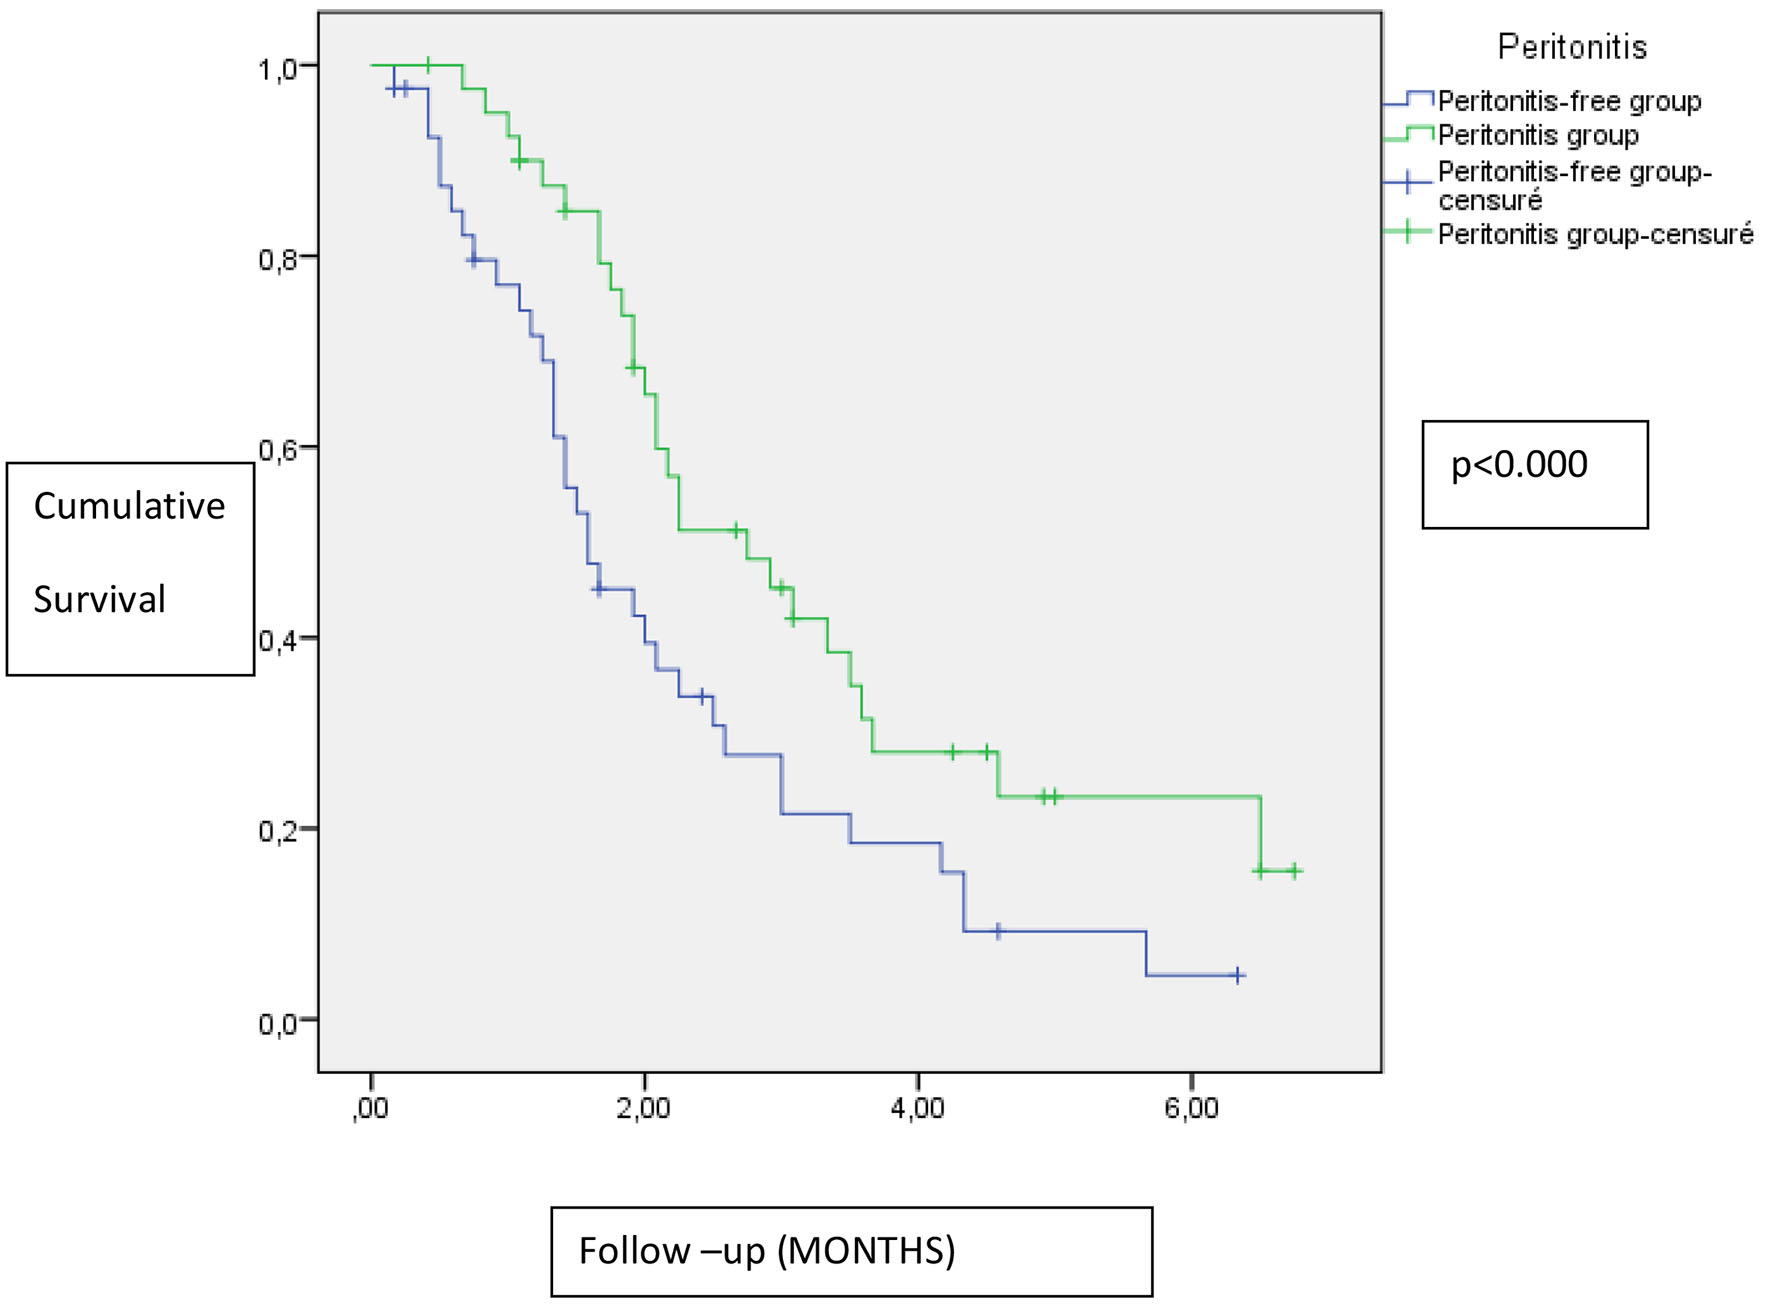
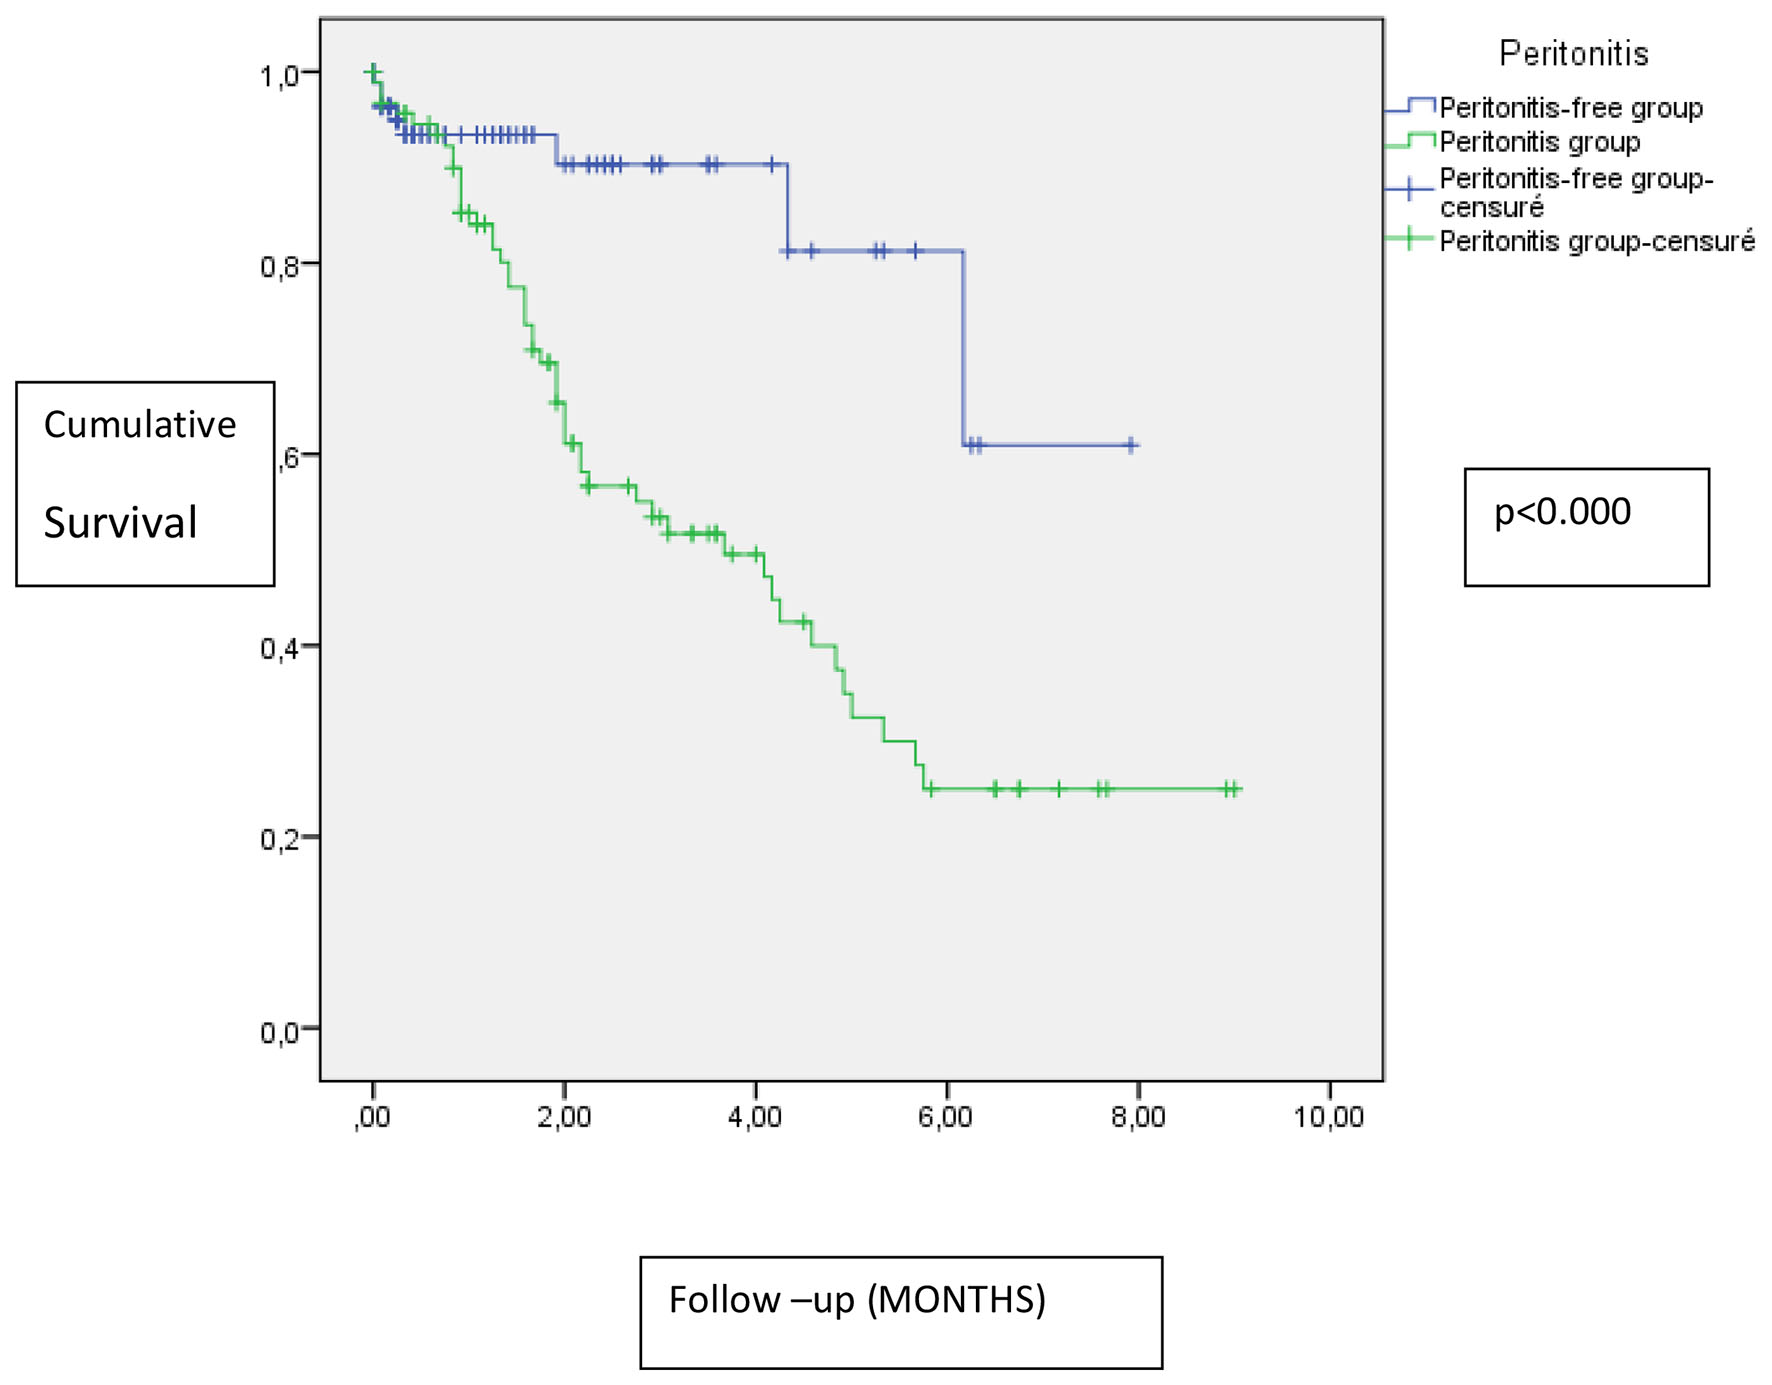
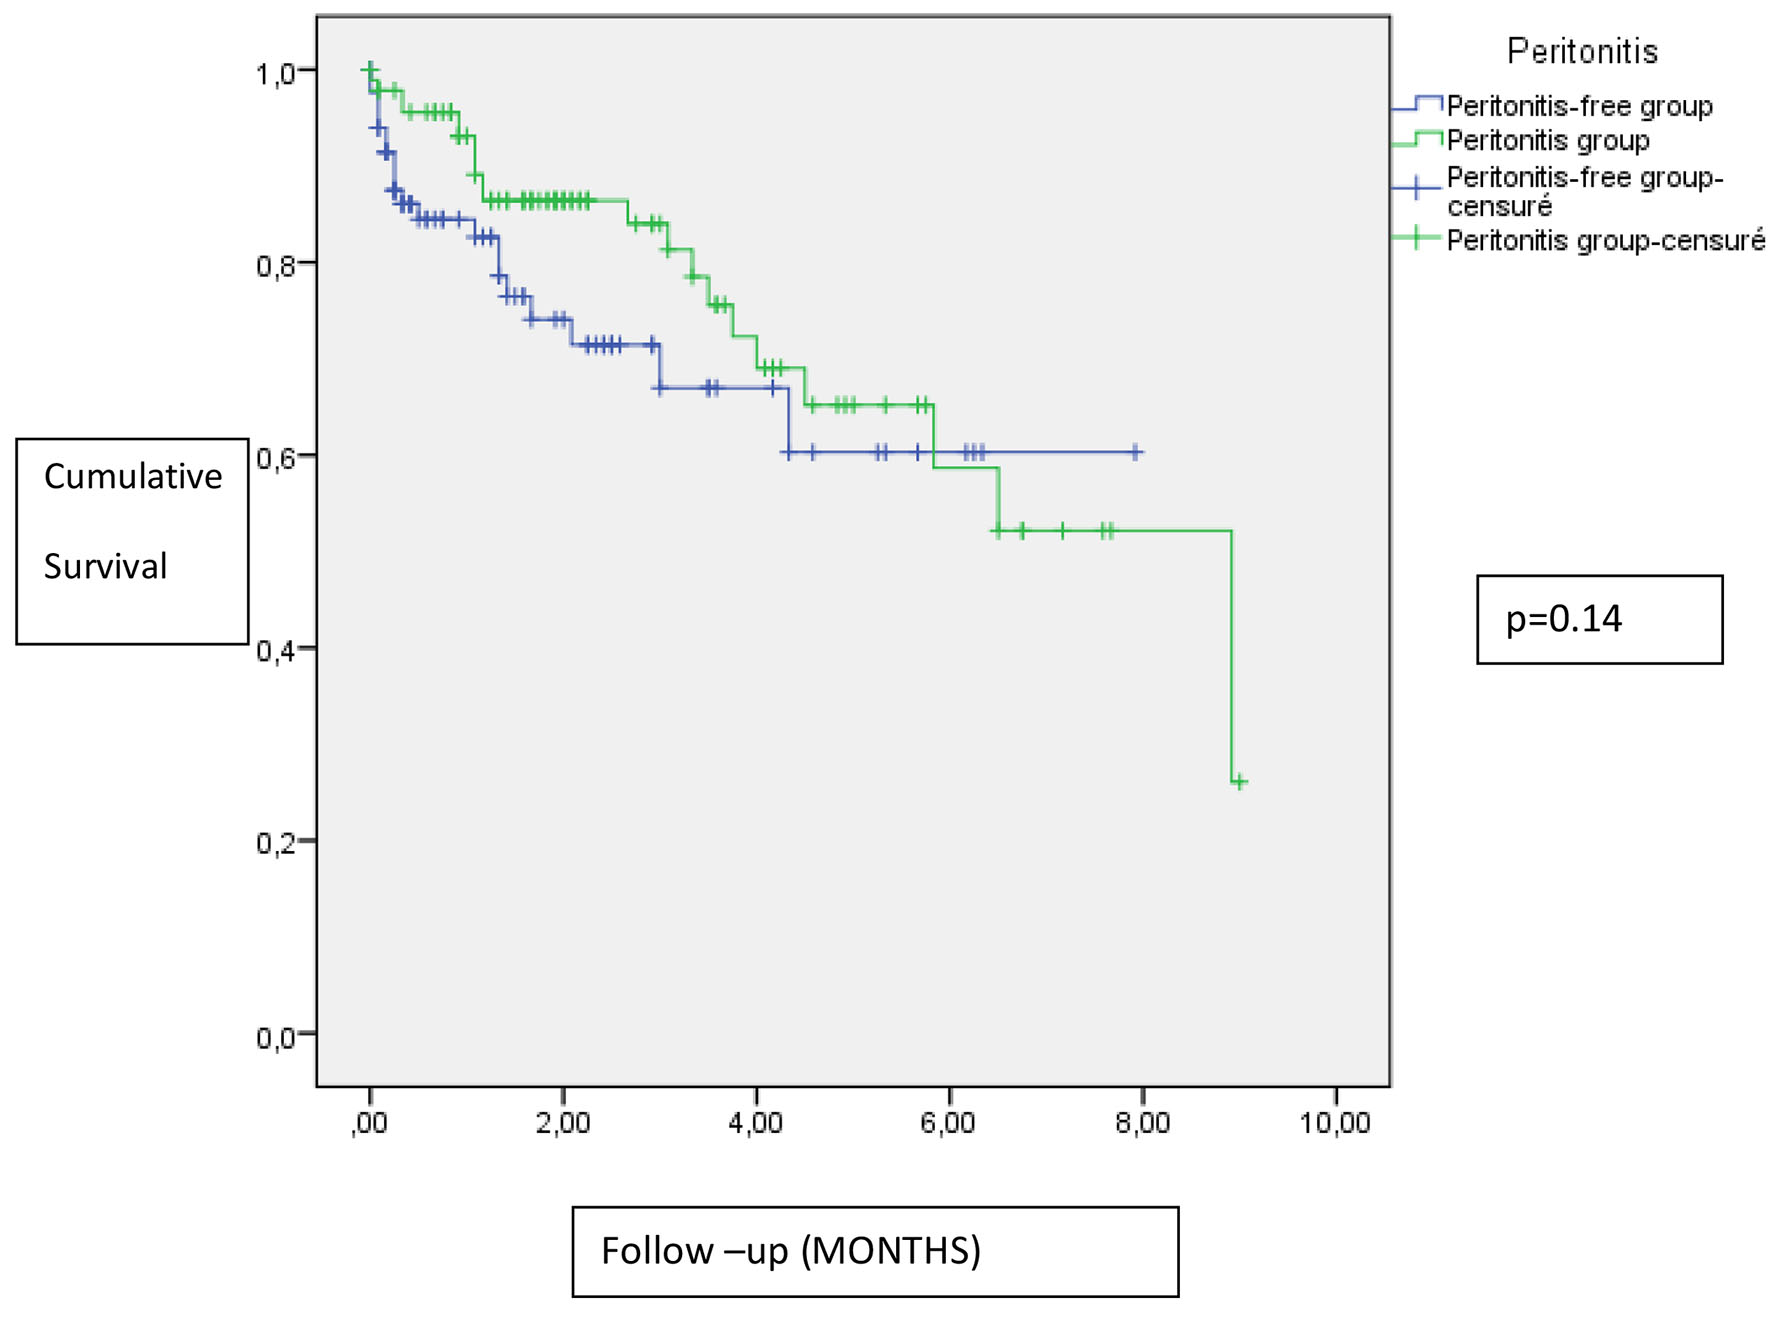
Figure 1. Impact of peritonitis on residual renal function.
| World Journal of Nephrology and Urology, ISSN 1927-1239 print, 1927-1247 online, Open Access |
| Article copyright, the authors; Journal compilation copyright, World J Nephrol Urol and Elmer Press Inc |
| Journal website http://www.wjnu.org |
Original Article
Volume 7, Number 2, June 2018, pages 45-52
Microbiology Risk Factors and Outcomes of Peritonitis in Tunisian Peritoneal Dialysis Patients
Figures
Tables
| Patients (n) | 182 |
| Sex (male/female) | 109:73 |
| Age (years, mean ± standard deviation) | 43.93 ± 16.95 |
| Mean duration of follow-up (months) | 27 .75 ± 26.18 |
| Underlying disease, n (%) | |
| Chronic glomerulonephritis | 25 (13.73) |
| Diabetes mellitus | 64 (35.16) |
| Hypertension | 16 (8.79) |
| Interstitial nephropathy | 41 (22.52) |
| Others or unknown | 36 (19.8) |
| Number of peritonitis | Number of patients |
|---|---|
| 1 | 46 |
| 2 | 21 |
| 3 | 14 |
| 4 | 5 |
| 5 | 3 |
| 6 | 2 |
| 9 | 1 |
| Group of microorganism | n (%) |
|---|---|
| Gram-positive cocci | 26 (27.92) |
| Staphylococcus aureus | 16 (17.20) |
| Staphylococcus epidermidis | 3 (3.22) |
| Streptococcus | 7 (7.5) |
| Gram-negative rods | 22 (23.9) |
| Pseudomonas | 6 (6.45) |
| Acinetobacter | 2 (2.15) |
| Enterobacter | 3 (3.22) |
| Klebsiella pneumoniae | 5 (5.37) |
| Escherichia coli | 6 (6.45) |
| Candida albicans | 5 (5.37) |
| Aspergillus | 1 (1.07) |
| Others | 4 (4.3) |
| Culture-negative | 34 (36.55) |
| Number | Percentage | |
|---|---|---|
| Lack of asepsis | 140 | 78.2 |
| Extender crack | 2 | 1.1 |
| Endogenous cause | 2 | 1.1 |
| Other infectious source | 4 | 2.2 |
| Exit-site infection | 14 | 7.8 |
| Catheter disconnection | 3 | 1.6 |
| Catheter breaking | 1 | 0.5 |
| Catheter crack | 2 | 1.1 |
| Defective material | 4 | 2.2 |
| Unknown cause | 7 | 3.9 |
| Peritonitis-free (n = 89), % | Peritonitis** (n = 93), % | P value | |
|---|---|---|---|
| Values are expressed as mean ± SD, or number (%). GFR: glomerular filtration rate (estimated by the average of renal BUN and creatinine clearance). *Defined as the presence of coronary artery disease, cerebrovascular disease or peripheral artery disease. **At least one peritonitis. CRP: C-reactive protein. | |||
| Sex (men) | 50 | 56 | 0.67 |
| Age (years) | 43 ± 15 | 44 ± 18 | 0.62 |
| Anuria | 11 (12.3) | 12 (12.9) | 0.52 |
| Ultrafiltration (mL) | 1,715 ± 732 | 1,632 ± 594 | 0.67 |
| Diabetes mellitus | 26 | 35 | 0.08 |
| Hypertension | 36 | 52 | 0.08 |
| Cardiovascular disease* | 8 | 15 | 0.33 |
| Serum albumin (g/dL) | 28.6 ± 5.23 | 28.88 ± 5.4 | 0.87 |
| Blood hemoglobin (g/dL) | 8.54 ± 1.31 | 8.57 ± 1.54 | 0.94 |
| Serum calcium (mg/dL) | 2.15 ± 0.24 | 2.12 ± 0.26 | 0.67 |
| Serum phosphorous (mg/dL) | 1.8 ± 0.64 | 1.73 ± 0.56 | 0.52 |
| Serum cholesterol (mg/dL) | 3.51 ± 2.35 | 3.01 ± 1.51 | 0.41 |
| CRP | 8.18 ± 15 | 10.36 ± 17 | 0.6 |
| Ferritin (µg/L) | 29.61 ± 253 | 351 ± 460 | 0.53 |
| NPCR (g/kg/day) | 0.91 ± 0.43 | 1 ± 0.29 | 0.27 |
| Baseline PD adequacy | |||
| Total KT/V urea | 2.63 ± 0.88 | 2.69 ± 0.95 | 0.75 |
| Residual GFR (mL/min/1.73 m2) | 2.19 ± 2.06 | 3.54 ± 3.6 | 0.16 |
| Total creatinine clearance (L/week) | 77.27 ± 31.59 | 83.88 ± 28.51 | 0.33 |
| Multivariate analysis | |||
|---|---|---|---|
| HR | 95 % CI | P | |
| Residual GFR (mL/min/1.73 m2) | 1.17 | 0.97 - 1.42 | 0.085 |
| Diabetes mellitus | 0.77 | 0.27 - 2.15 | 0.61 |
| Hypertension | 1.37 | 0.55 - 3.43 | 0.49 |
| N: number of episodes. CoNS: coagulase-negative staph. | |||||||
| Country | Scotland | USA | Canada | Korea | Tokyo | Toronto | Australia |
| Source | Registry | Multicenter database | Multicenter database | Single center | 13 centers | Single center | Regional |
| Episodes (N) | 928 | 1,142 | 2,886 | 1,108 | - | 485 | 145 |
| Period of observation | 1999 - 2002 | 1998 - 2004 | 1998 - 2004 | 1992 - 2001 | 2005 - 2007 | 1995 - 2000 | 2000 - 2001 |
| Gram-positive | - | 62% | 61% | 44.9% | 42.7% | 53.6% | 46.9% |
| CoNS | 29.5% | 18.07 | 16.36 | 25.2% | 12% | 25.15% | 24.13% |
| S. aureus | 19.2% | 31.05 | 42.48 | 13.6% | 26 | 14.4% | 6.9% |
| Gram-negative | 15.7% | 20.5 | 23.6 | 14.7% | 18.6% | 20.4% | 24.13% |
| Fungi | 15.2% | 3.92 | 3.66 | 2.16% | 3.3% | 6.8% | 4.8% |
| Culture-negative | 3.6% | 15.9 | 18.5 | 36.9% | 31.8% | 10.9% | 16% |
| Author | Kavanagh et al [1] | Mujais [14] | Mujais [14] | Kim et al [15] | Masashi et al [12] | Krishnan et al [16] | Kan et al [17] |