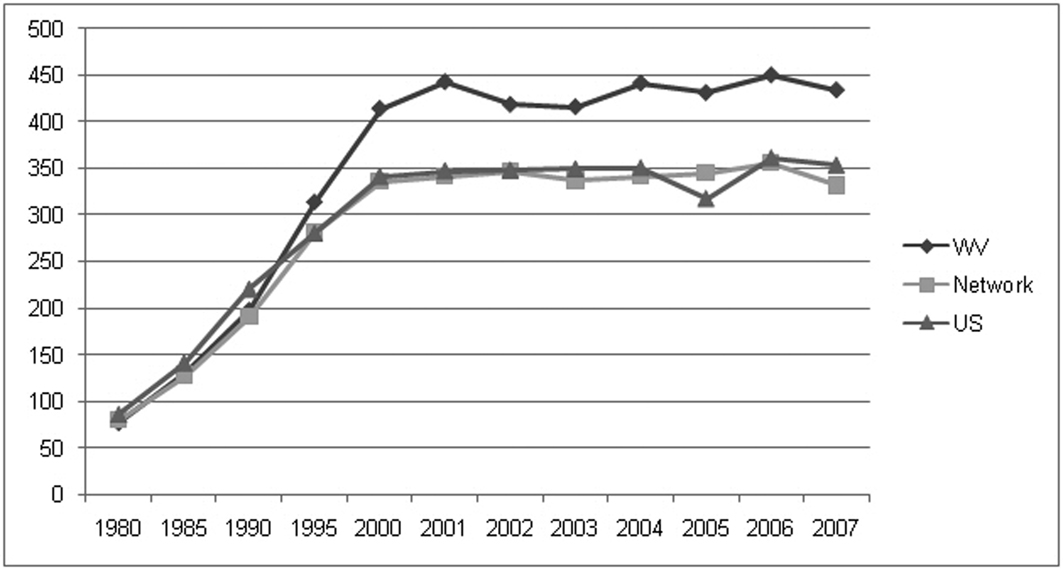
Figure 1. Incidence of ESRD (persons per million population) from 1980 to 2007 for West Virginia, Network 5 and the US [2].
| World Journal of Nephrology and Urology, ISSN 1927-1239 print, 1927-1247 online, Open Access |
| Article copyright, the authors; Journal compilation copyright, World J Nephrol Urol and Elmer Press Inc |
| Journal website http://www.wjnu.org |
Original Article
Volume 1, Number 1, February 2012, pages 8-15
Prevalence and Predictive Value of Hypoalbuminemia in Appalachians With Chronic Kidney Disease
Figures
Tables
| Stage | All | |||||
|---|---|---|---|---|---|---|
| *Patients with eGFRs. | ||||||
| 1 | 2 | 3 | 4 | 5 | ||
| Number of patients* | 313 | 690 | 1767 | 972 | 516 | 4258* |
| Diagnosis of diabetes (%) | 71 (23%) | 210 (30%) | 733 (41%) | 428 (44%) | 235 (46%) | 1677 (39%) |
| Caucasian (%) | 89% | 94% | 95% | 96% | 92% | 94.3% |
| Female (%) | 58% | 50% | 51% | 55% | 52% | 52% |
| Age (mean ± SD) | 38.88 ± 15.65 | 51.28 ± 15.93 | 63.70 ± 14.22 | 66.21 ± 14.19 | 60.81 ± 15.51 | 60.1 ± 16.7 |
| Age > 65 (%) | 6% | 21% | 51% | 60% | 45% | 44% |
| eGFR (ml/min), (mean ± SD) | 110.67 ± 22.4 | 72.96 ± 8.59 | 43.27 ± 8.45 | 22.75 ± 4.26 | 10.03 ± 2.96 | |
| Stage | Mean first Hgb | SD | Mean first PTH | SD | Mean first calcium | SD | Mean first albumin | SD | % ≤ 3.5 gm/dl |
|---|---|---|---|---|---|---|---|---|---|
| 1 | 13.78 | 1.91 | 67.14 | 41.80 | 9.30 | 1.21 | 3.58 | 0.67 | 39% |
| 2 | 13.49 | 1.70 | 80.94 | 116.62 | 9.22 | 0.63 | 3.71 | 0.61 | 28% |
| 3 | 12.90 | 1.78 | 94.68 | 84.93 | 9.25 | 0.69 | 3.67 | 0.57 | 33% |
| 4 | 12.12 | 1.83 | 137.01 | 115.98 | 9.05 | 0.77 | 3.49 | 0.66 | 45% |
| 5 | 11.78 | 1.74 | 261.86 | 310.55 | 8.73 | 0.95 | 3.21 | 0.70 | 62% |
| All | 12.82 | 1.79 | 128.33 | 133.98 | 9.11 | 0.85 | 3.58 | 0.63 | 39% |
| Stage | WV CKD (mean ± SE) | NHANES CKD (mean ± SE) | WV CKD (mean ± SD) | Urban Public Health System (mean ± SD) |
|---|---|---|---|---|
| P < 0.0001 except where *P = 0.001; †P = 0.16; ‡ = NS. | ||||
| 3a | 3.67 ± 0.02 | 4.2 ± 0.01 | 3.67 ± 0.58 | 4.0 ± 0.6 |
| 3b | 3.67 ± 0.02 | 4.1 ± 0.02 | 3.67 ± 0.57‡ | 3.7 ± 0.8‡ |
| 4 | 3.49 ± 0.02 | 4 ± 0.04 | 3.49 ± 0.66† | 3.4 ± 0.8† |
| 5 | 3.21 ± 0.04 | 4.1 ± 0.16 | 3.21 ± 0.70* | 3.4 ± 0.7* |
| % < FPL† | Life expectancy rates‡ | |||
|---|---|---|---|---|
| *Average values at first presentation for West Virginia patients (mean ± SE); † From counties where percent of residents living below the federal poverty level exceeds national average (13.2%); ‡ From counties with low life expectancy rates. | ||||
| High | Low | High | Low | |
| eGFR (ml/min)* | 49.95 ± 0.45 | 43.85 ± 4.31 | 41.34 ± 1.00 | 46.75 ± 0.59 |
| P = 0.06 | P < 0.0001 | |||
| albumin (g/dl)* | 3.46 ± 0.01 | 3.68 ± 0.08 | 3.71 ± 0.22 | 3.48 ± 0.01 |
| P = 0.04 | P < 0.0001 | |||