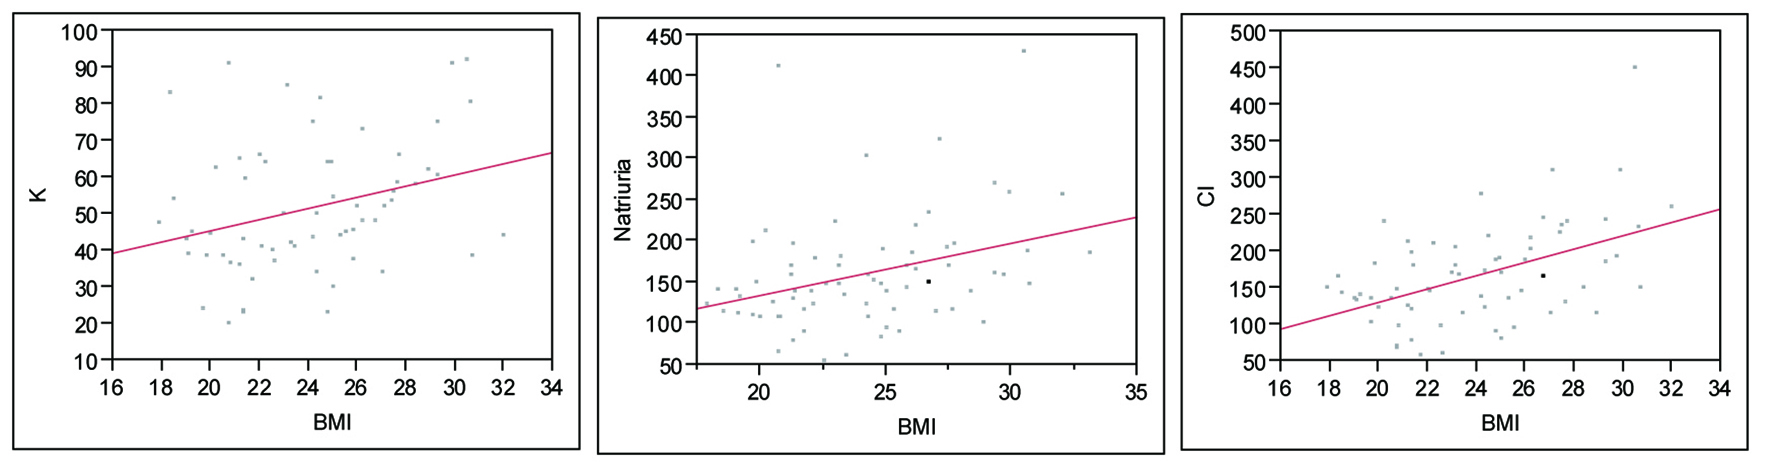
Figure 1. Urinary excretion of K, Na and Cl by BMI. K: P = 0.01, R2 = 0.31; Natriuria (Na): P = 0.0042, R2 = 0.33; Cl: P ≤ 0.0001, R2 = 0.49.
| World Journal of Nephrology and Urology, ISSN 1927-1239 print, 1927-1247 online, Open Access |
| Article copyright, the authors; Journal compilation copyright, World J Nephrol Urol and Elmer Press Inc |
| Journal website http://www.wjnu.org |
Original Article
Volume 1, Number 1, February 2012, pages 29-35
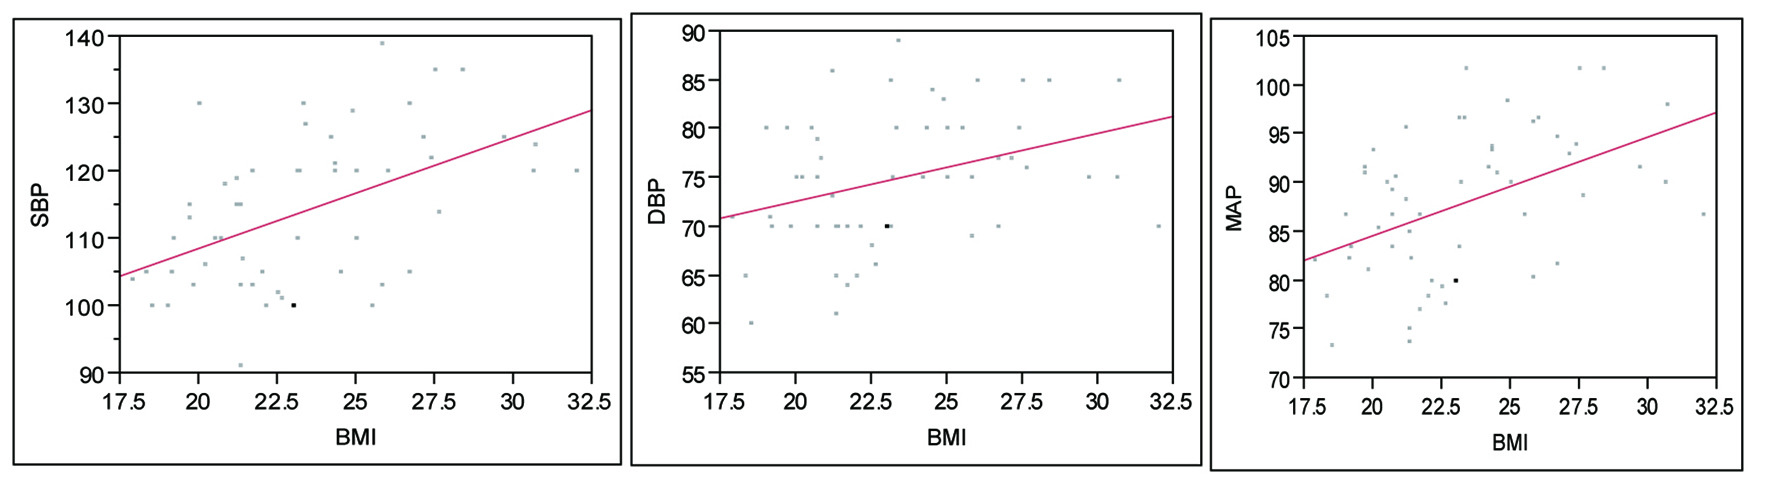
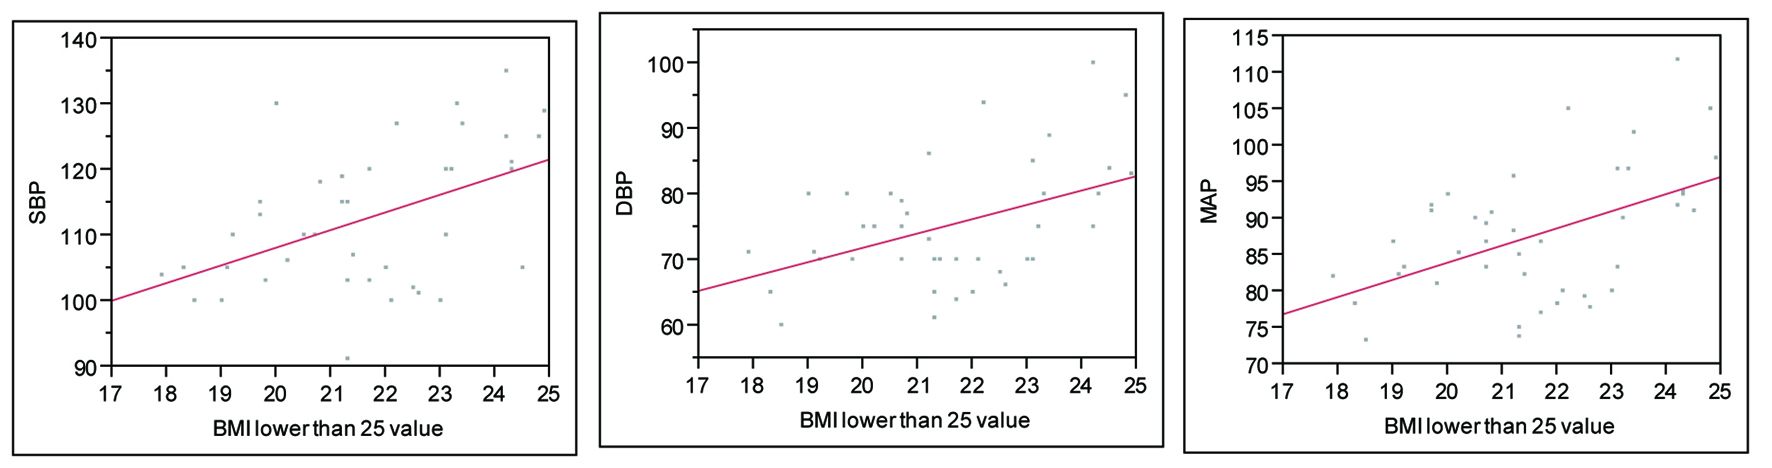
Effects of BMI on Blood Pressure and Urinary Excretion of Sodium, Chloride and Potassium in Young Paraguayans
Figures
Tables
| N = 72. | |
| BMI kg/m2 (Mean ± SD) | 24.1 ± 3.6 |
| Male sex, N% | 36 (50%) |
| Urinary Na (mEq/24hs), Mean ± SD | 159.7 ± 69 |
| Urinary K (mEq/24hs), Mean ± SD | 51.5 ± 17.7 |
| C1 in urine (mEq/24hs), Mean ± SD | 166.7 ± 66.7 |
| SBP (mmHg), Mean ± SD | 117.1 ± 12.2 |
| DBP (mmHg), Mean ± SD | 78.3 ± 10.1 |
| MAP, Mean ± SD | 91.3 ± 10.1 |
| Abd Circunference (cm), Mean ± SD | 82.1 ± 12.2 |
| Age (years), Mean ± SD | 25.2 ± 1.5 |
| Family Hx of HTN, N% | 49 (68%) |
| Smoking, N% | 11 (15%) |
| BMI < 25 N = 44 | BMI equal or higher than 25, N = 27 | P | |
|---|---|---|---|
| SBP mmHg, (Mean, SD) | 112 ± 10.5 | 124 ± 11.7 | 0.0001 |
| DBP mmHg, (Mean, SD) | 75.4 ± 8.96 | 83.84 ± 10.1 | 0.0013 |
| MAP (Mean, SD) | 87.8 ± 8.80 | 97.4 ± 9.62 | 0.0002 |
| Age | 25 ± 1.44 | 25.53 ± 1.67 | 0.26 |
| Male gender, N (%) | 15 (34) | 20 (74) | 0.001 |
| Urinary Na > 150 mEq/24 hours | 15 (34%) | 17 (62%) | 0.01 |
| Term | Estimate | Std Error | t Ratio | P value |
|---|---|---|---|---|
| Intercept | 100 | 8.6 | 11.62 | < 0.0001* |
| Male gender | 7.3 | 1.2 | 5.80 | < 0.0001* |
| BMI | 0.7 | 0.3 | 2.06 | 0.0431* |